
BLS recently participated in the North American Transportation Statistics Interchange, better known as the NATS Interchange. (Not to be confused with the local baseball team, as the Washington Nationals are known. I look forward to the day when I’m back in the stands yelling “N-A-T-S, Nats, Nats, Nats — whoooo!” after each run scores. But I digress.)
Like many recent conferences, the NATS Interchange was held virtually and focused on the pandemic—how statistical agencies in the United States, Mexico, and Canada continued operations, produced new data, and are planning for the future. Our friends at the Bureau of Transportation Statistics, part of the U.S. Department of Transportation, led the U.S. effort and invited several other U.S. statistical agencies to share information. BLS was asked to participate in a short session on the transportation-related information we produce that may be useful in measuring the economic recovery. This turned into a great opportunity to focus on the BLS Industry at a Glance feature on our website, and to look further into what BLS has available related to transportation.
We classify workplaces by industry based on their principal product or activity. Industries are categorized using the North American Industry Classification System, or NAICS. BLS releases considerable data by NAICS classification, including employment, wages, workplace safety, and more. The BLS Industry at a Glance webpages bring these different statistics together for over 100 industries. Want to know everything BLS produces for the transportation and warehousing industry classification (NAICS codes 48–49)? It’s all there at Industry at a Glance. Want to dig deeper and look just at the air transportation industry (NAICS code 481)? We’ve got that, too. Of course, we may have less information available as you ask for more detailed classifications, but if we’ve got it, it’ll be there.
Let’s look at a couple of examples, starting with employment. In April 2020, BLS reported a loss of more than 20 million jobs in one month, based on data from the Current Employment Statistics program. The job losses were widespread, including a loss of 570,000 jobs in the transportation and warehousing industry from February to April. That’s a decline of 10 percent from the January 2020, level of 5.7 million workers in this industry. Through December, the sector had recovered about 84 percent of that job loss and still had a net loss of 90,000 jobs since January.
But looking at the overall sector hides some of the details. The job losses in early 2020 occurred in all components of transportation and warehousing except couriers and messengers. This industry recorded an increase of 210,000 employees from January to December 2020, likely due to the surge in online shopping and associated shipping and delivery. While initially losing jobs, employment in warehousing and storage was up 79,000 in December from the March level. All other sectors continue to have net losses. Of particular note is employment in air transportation, which showed inconsistent recovery for several months before recording new jobs losses in October.
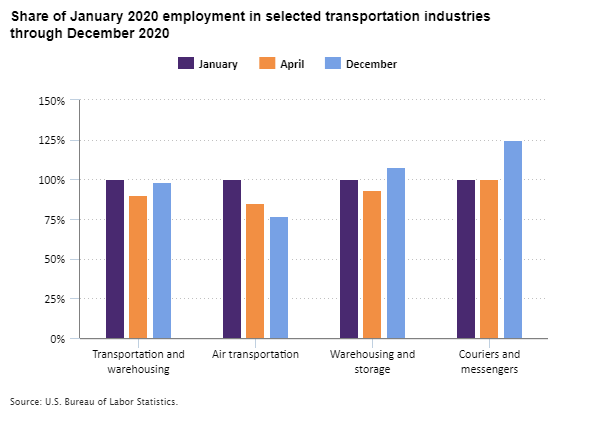
Editor’s note: Data for this chart are available in the table below.
Other details you can glean from the Industry at a Glance page for Transportation and Warehousing:
- 16.1 percent of wage and salary workers in the transportation and warehousing industry were members of a union in 2019, and 17.6 percent were represented by a union.
- The occupation with the most workers in this industry is heavy and tractor-trailer truck drivers, with nearly 1.1 million workers in 2019. The next largest occupation was school bus drivers, with about 284,000 workers.
- 948 workers in this industry suffered a fatal work injury in 2019, up from 909 fatalities in 2018.
In preparing for the NATS interchange, BLS took a broader look at the world of transportation statistics. Turns out, if you look beyond the industry classification, you find even more information. For example, BLS programs on prices and spending look at what consumers spend on transportation, and the change in transportation prices over time. From the BLS Consumer Expenditure Surveys, we know the average “consumer unit” (our fancy name for households) spent an average of $10,742 on transportation in 2019, including vehicle purchases and maintenance and public transportation.
The pandemic revealed major disruptions in certain transportation activity, and those disruptions were evident in the BLS Consumer Price Index. The CPI as a whole declined by 0.8 percent in April, the largest one-month decline in more than a decade. Many of the declines were the result of stay-at-home orders and related shutdowns, as prices for gasoline, airfares, and other transportation-related items declined sharply. Of note was a sharp decline in the price of gasoline—down over 20 percent in April.
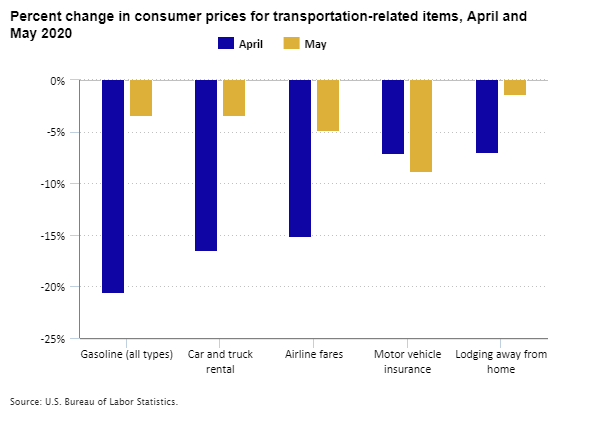
Editor’s note: Data for this chart are available in the table below.
To stretch the transportation concept just a little further, the BLS Census of Fatal Occupational Injuries records the “event or exposure” that results in each fatal work injury. Of the 5,333 fatal work injuries in 2019, nearly 40 percent were the result of a transportation incident. Such incidents may occur to workers in the transportation industry, such as truck drivers, but also to many other workers, including farmers, protective service officers, landscapers, and construction laborers. Transportation incidents are most often on a roadway but can also involve aircraft, rail, and water vehicles.
The NATS interchange asked BLS to consider what data might be helpful in tracking the recovery. Many of the transportation statistics discussed here, such as employment, consumer expenditures, and price changes, will likely provide a clue about returning to activity levels reached before the pandemic.
This exercise provided an opportunity to dig a little deeper into the transportation and warehousing industry and to expand the definition to explore related information. The BLS Industry at a Glance webpages offer that same opportunity to explore the current economic landscape of over 100 industries.
| Industry | January | April | December |
|---|---|---|---|
Transportation and warehousing | 100.0% | 90.0% | 98.4% |
Air transportation | 100.0 | 85.1 | 76.9 |
Warehousing and storage | 100.0 | 93.4 | 107.9 |
Couriers and messengers | 100.0 | 100.2 | 124.5 |
| Item | April | May |
|---|---|---|
Gasoline (all types) | -20.6 | -3.5 |
Car and truck rental | -16.6 | -3.5 |
Airline fares | -15.2 | -4.9 |
Motor vehicle insurance | -7.2 | -8.9 |
Lodging away from home | -7.1 | -1.5 |