
May is Asian Pacific American Heritage Month, so let’s take a closer look at national employment statistics for Asians and for Native Hawaiians and Other Pacific Islanders. We’ll focus on how labor market conditions for these groups continue to recover from the effects of the COVID-19 pandemic.
BLS has been collecting data in the Current Population Survey on the labor market characteristics of people who identify their race as Asian or Native Hawaiian or Other Pacific Islander since 2003. Looking at historical data, the employment–population ratio—the percentage of the population that is employed—is generally higher for Asians and for Native Hawaiians or Other Pacific Islanders than the U.S. average. The ratio in 2019 was 62.3 percent for Asians and 66.2 percent for Native Hawaiians or Other Pacific Islanders, well above the national average of 60.8 percent. The ratios for all groups declined sharply in 2020 with the onset of the COVID-19 pandemic. Employment–population ratios had not yet fully recovered in 2021, but the ratios for Asians and Native Hawaiians or Other Pacific Islanders continued to be higher than the U.S. average. The greater likelihood of employment among Asians and Native Hawaiians or Other Pacific Islanders reflects the fact that larger shares of both groups are ages 25 to 54 than the overall population. People in this age range are more likely to be employed than people in younger and older age groups.
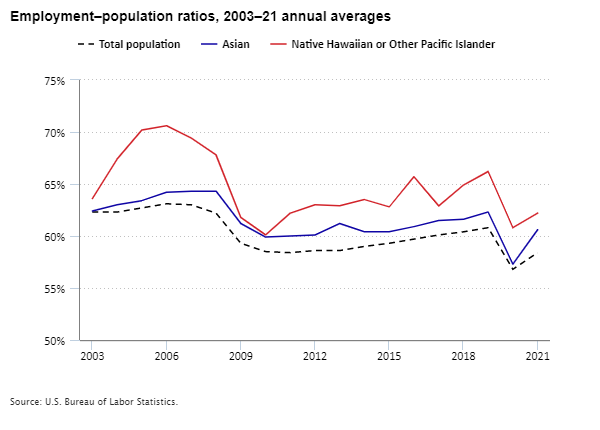
Editor’s note: Data for this chart are available in the table below.
The following chart shows how the labor market improved in 2021 compared to 2020 but remained below its 2019 pre-pandemic level. The employment–population ratio increased by 1.6 percentage points from 2020 to 2021 but remained 2.4 percentage points below its 2019 level. Similarly, this ratio increased by 3.3 percentage points for Asians and 1.4 percentage points for Native Hawaiians or Other Pacific Islanders in 2021. The ratio for Asians in 2021 was still 1.7 percentage points lower than in 2019, while the ratio for Native Hawaiians or Other Pacific Islanders was still 4.0 percentage points lower.
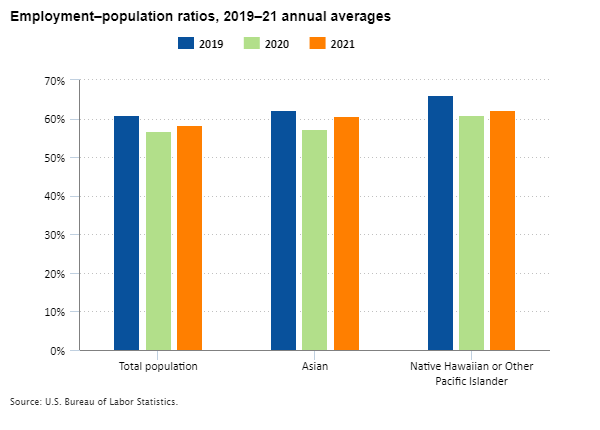
Editor’s note: Data for this chart are available in the table below.
The increase in the employment–population ratio between 2020 and 2021 varied for different groups within the Asian population. For example, this measure rose by 3.7 percentage points for Asian women and 2.9 percentage points for Asian men in 2021. The rise in the employment–population ratio was about twice as large for workers ages 16 to 24 (4.0 percentage points) and 25 to 54 (4.1 percentage points) than those age 55 and older (2.0 percentage points). Similarly, the increase in the percentage of foreign-born Asians (3.9 percentage points) who were employed was more than twice the increase for native-born Asians (1.8 percentage points). (Unfortunately, we can’t make these same comparisons for Native Hawaiians or Other Pacific Islanders because of their small sample size in the survey.)
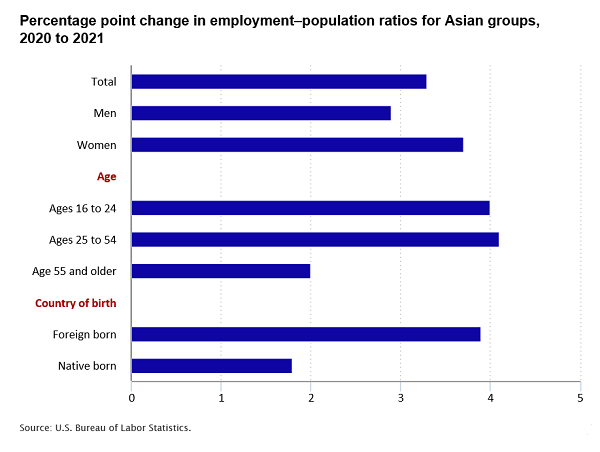
Editor’s note: Data for this chart are available in the table below.
Asian Americans trace their roots to many different distinct and culturally diverse peoples. We collect information on seven different Asian groups—Asian Indian, Chinese, Filipino, Japanese, Korean, Vietnamese, and Other Asian. As shown in the chart below, Asian Indians and Chinese are the largest groups of Asian Americans. Japanese, at 5 percent, represent the smallest share.
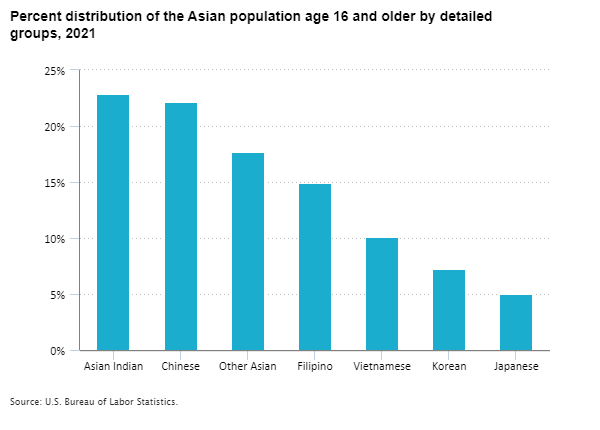
Editor’s note: Data for this chart are available in the table below.
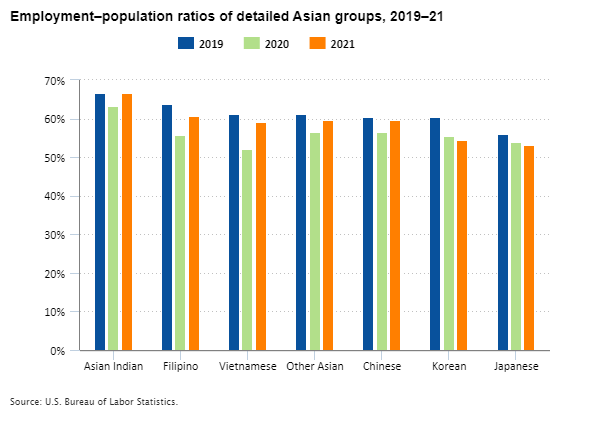
Although the employment–population ratios for many of these groups increased in 2021, most remained below their 2019 pre-pandemic levels. After having the largest decline in their employment–population ratio from 2019 to 2020 (-9.2 percentage points), Vietnamese had the largest over-the-year gain in 2021 (7.1 percentage points) but remained 2.1 percentage points below the 2019 level. The employment–population ratio for Koreans in 2021, 5.9 percentage points below the 2019 level, had the largest decline over this 2-year period. The employment–population ratio of Asian Indians, however, had returned to the 2019 level in 2021.
Editor’s note: Data for this chart are available in the table below.
This is just a sample of the information available on the labor force status of Asian Americans and Native Hawaiians and Other Pacific Islanders. Explore some of our other resources to expand your knowledge.
- The Employment Situation news release
- Labor force characteristics by race and ethnicity
- Usual Weekly Earnings of Wage and Salary Workers news release
- Union Members news release
- Employment Characteristics of Families news release
- Geographic Profile of Employment and Unemployment
| Year | Total population | Asian | Native Hawaiian or Other Pacific Islander |
|---|---|---|---|
2003 | 62.3% | 62.4% | 63.6% |
2004 | 62.3 | 63.0 | 67.4 |
2005 | 62.7 | 63.4 | 70.2 |
2006 | 63.1 | 64.2 | 70.6 |
2007 | 63.0 | 64.3 | 69.4 |
2008 | 62.2 | 64.3 | 67.8 |
2009 | 59.3 | 61.2 | 61.8 |
2010 | 58.5 | 59.9 | 60.1 |
2011 | 58.4 | 60.0 | 62.2 |
2012 | 58.6 | 60.1 | 63.0 |
2013 | 58.6 | 61.2 | 62.9 |
2014 | 59.0 | 60.4 | 63.5 |
2015 | 59.3 | 60.4 | 62.8 |
2016 | 59.7 | 60.9 | 65.7 |
2017 | 60.1 | 61.5 | 62.9 |
2018 | 60.4 | 61.6 | 64.9 |
2019 | 60.8 | 62.3 | 66.2 |
2020 | 56.8 | 57.3 | 60.8 |
2021 | 58.4 | 60.6 | 62.2 |
| Year | Total population | Asian | Native Hawaiian or Other Pacific Islander |
|---|---|---|---|
2019 | 60.8% | 62.3% | 66.2% |
2020 | 56.8 | 57.3 | 60.8 |
2021 | 58.4 | 60.6 | 62.2 |
| Characteristic | Change from 2020 to 2021 | 2020 | 2021 |
|---|---|---|---|
Total | 3.3 | 57.3 | 60.6 |
Men | 2.9 | 65.4 | 68.3 |
Women | 3.7 | 50.2 | 53.9 |
Age | |||
Ages 16 to 24 | 4.0 | 33.4 | 37.4 |
Ages 25 to 54 | 4.1 | 73.5 | 77.6 |
Age 55 and older | 2.0 | 37.3 | 39.3 |
Country of birth | |||
Foreign born | 3.9 | 57.0 | 60.9 |
Native born | 1.8 | 57.5 | 59.3 |
| Asian group | Percent distribution |
|---|---|
Asian Indian | 22.9% |
Chinese | 22.1 |
Other Asian | 17.7 |
Filipino | 14.9 |
Vietnamese | 10.1 |
Korean | 7.2 |
Japanese | 5.0 |
| Year | 2019 | 2020 | 2021 |
|---|---|---|---|
Asian Indian | 66.6% | 63.2% | 66.6% |
Filipino | 63.9 | 55.8 | 60.6 |
Vietnamese | 61.2 | 52.0 | 59.1 |
Other Asian | 61.1 | 56.5 | 59.7 |
Chinese | 60.4 | 56.6 | 59.7 |
Korean | 60.3 | 55.6 | 54.4 |
Japanese | 56.1 | 53.8 | 53.1 |