In 2021, the BLS public website welcomed nearly 29 million users, who viewed just over 158 million pages. Wow, that’s a lot of data! It shows the extensive and growing interest in information about our economy. Let’s take a quick look back over the past year. What are the topics of interest? We see clear trends and a few surprises.
From its humble beginnings more than a quarter century ago, www.bls.gov has become the primary way we make the latest BLS data and analysis available to the public.
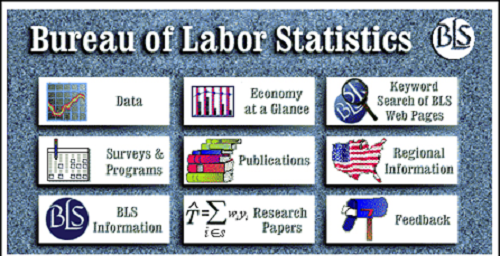
 First edition of the BLS website, 1995
Today, thousands of users get their first glimpse of the latest economic data through the website or through email alerts and tweets that link to the website. National economic news on employment, inflation, productivity, and other topics is first available on the website, with about 150 national releases each year. Not to be outdone, BLS regional office staff around the country last year posted nearly 1,000 regional and local news releases on the website.
And you came to check out those data—all 29 million of you.
Here’s a look at the five subject homepages that saw the greatest increase in page views from 2020 to 2021. You’ll note that all are timely topics.
- The Business Response Survey to the Coronavirus Pandemic was a special data collection effort. Information from this survey was first available late in 2020, so the 166-percent increase in page views in 2021 is not surprising, especially given the great interest in all COVID-19 information. Results from a second round of this survey, with updated questions, will be available February 9, 2022.
- Information from the Consumer Price Index also had more than a 100-percent increase in page views from 2020 to 2021, 106 percent increase to be exact. This is not a surprise, given the significant rise in prices recently.
- Interest in inflation throughout the supply chain also led to a 60-percent increase in page views for Producer Price Indexes data.
- BLS has been collecting data on Work Stoppages (strikes and lockouts) for many years, but interest in these data grew in 2021, perhaps because of several high-profile stoppages. There was a 25-percent increase in page views for these data.
- Rounding out the top five was an 18-percent increase in page views for Job Openings and Labor Turnover Survey data. With record numbers of job openings and heightened interest in churn in the labor force, these data have garnered much attention recently. We also began publishing a news release on state data in 2021 to meet the growing need for geographic information on job openings and labor turnover.
Turning to analytical data, some of the most viewed pages were those focusing on fast growing industries, inflation at both the consumer and producer level, and the impact of COVID-19 on many aspects of the economy, such as unemployment and food prices. But viewers were also attracted to some unique topics:
- The most read Commissioner’s Corner blog was about the 17-year cycle of cicadas, with a look at economic trends during past cicada invasions.

- And the most read Beyond the Numbers article looked at how much time Americans spend watching television, with data from the American Time Use Survey.

We welcome our 29 million website visitors and encourage you to check back regularly. Your interests drive our commitment to provide timely research on relevant topics. There’s new content every business day, so you never know what new research may be right around the corner in 2022. It will all be at www.bls.gov. See you there!
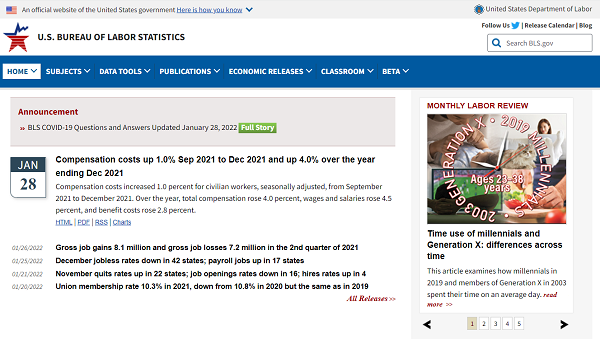
 BLS website homepage in 2022
 United States Department of Labor