Small-business options: Occupational outlook for self-employed workers
Elka Torpey and Brian Roberts | May 2018
Before starting a business, you may want to research which occupations are expected to have strong growth for self-employed workers. And a good place to begin is with projections data from the U.S. Bureau of Labor Statistics (BLS).
BLS counts self-employment in different ways. By one count, there were about 9.6 million self-employed workers in 2016—and BLS projects this number to increase to 10.3 million by 2026. That’s a 7.9-percent growth rate, slightly faster than the 7.4-percent rate projected for all workers.
This article highlights selected occupations that are projected to have many jobs for, or high concentrations of, self-employed workers. It compares self-employment rates for those selected occupations with the percentage of all workers projected to be self-employed in 2026.
Many new jobs
Projected growth in self-employment varies by occupational group. BLS projects service occupations, such as those in personal care and in cleaning and maintenance, to have many new jobs for self-employed workers from 2016 to 2026. (See chart 1.)
Chart 1. New jobs for self-employed workers, projected 2016–26, by selected occupational group
| Occupational group |
New jobs for self-employed workers, projected 2016−26 |
Self-employment, projected 2026 |
Percent of occupational group self-employed, projected 2026 |
|
Personal care and service
|
135,900 |
1,173,800 |
15.3 |
|
Building and grounds cleaning and maintenance
|
83,000 |
785,100 |
12.7 |
|
Construction and extraction
|
78,300 |
1,271,700 |
16.8 |
|
Management
|
70,100 |
1,960,200 |
19 |
|
Transportation and material moving
|
60,200 |
516,600 |
4.7 |
|
Business and financial operations
|
56,800 |
499,400 |
5.6 |
|
Arts, design, entertainment, sports, and media
|
46,600 |
744,500 |
25.3 |
By detailed occupation, BLS projects self-employment to grow in some occupations and to decline in others. For example, the occupation of farmers, ranchers, and other agricultural managers—which had nearly 750,000 self-employed workers in 2016, the most of any occupation—is projected to lose about 21,000 jobs by 2026. But the occupations in chart 2, including childcare workers, real estate sales agents, and management analysts, are projected to have many new jobs for self-employed workers from 2016 to 2026.
Chart 2. Self-employment in selected occupations, 2016 and projected 2026 (percent)
| Occupation |
Self-employment, 2016 |
Percent of occupation self-employed, 2016 |
Self-employment, projected 2026 |
Percent of occupation self-employed, projected 2026 |
|
Childcare workers
|
350,400 |
28.8 |
378,900 |
29.1 |
|
Carpenters
|
340,300 |
33.2 |
362,500 |
32.7 |
|
Construction laborers
|
304,800 |
25.1 |
324,700 |
23.8 |
|
Hairdressers, hairstylists, and cosmetologists
|
264,600 |
42.9 |
299,100 |
42.9 |
|
Landscaping and groundskeeping workers
|
262,100 |
21.9 |
293,600 |
22.0 |
|
Real estate sales agents
|
194,700 |
55.8 |
207,700 |
56.3 |
|
Maids and housekeeping cleaners
|
177,200 |
12.3 |
197,900 |
12.9 |
|
Painters, construction and maintenance
|
161,400 |
42.3 |
172,000 |
42.6 |
|
Management analysts
|
140,200 |
17.4 |
169,400 |
18.4 |
|
Taxi drivers and chauffeurs
|
110,600 |
36.3 |
155,000 |
48.4 |
Half of the occupations in chart 2 typically require no formal educational credential for entry, but they might need other qualifications. Taxi drivers and chauffeurs, for example, may need a taxi or limousine license in addition to a regular driver’s license.
High concentration
Of the groups shown in chart 1, the arts, design, entertainment, sports, and media group is projected to add the fewest jobs for self-employed workers from 2016 to 2026. However, 25 percent of jobs in these occupations are projected to be for self-employed workers in 2026, the highest concentration of any group.
Chart 3 shows the percentage of workers projected to be self-employed in selected occupations in the highest concentration group in 2026. The chart also shows the percentage of self-employed for all occupations projected for 2026: 6.2 percent. Although these workers focus on different tasks, all of the occupations involve creativity.
Chart 3. Arts, design, entertainment, sports, and media occupations projected to have high concentrations of self-employed workers, 2026
| Occupation |
Percent self-employed, projected 2026 |
Self-employment, projected 2026 |
|
Photographers
|
80.6 |
112,000 |
|
Writers and authors
|
63.1 |
89,200 |
|
Art directors
|
58.7 |
55,900 |
|
Multimedia artists and animators
|
56.7 |
45,300 |
|
Musicians and singers
|
35.2 |
64,400 |
|
Graphic designers
|
18.3 |
50,900 |
|
Total, all occupations
|
6.2 |
|
Most of the occupations in chart 3 typically require a bachelor’s degree for entry. Musicians and singers, the one occupation that typically requires no formal education to enter, does require an ability or talent that must be cultivated over several years—which is also the case for photographers and writers and authors.
High pay for self-employed
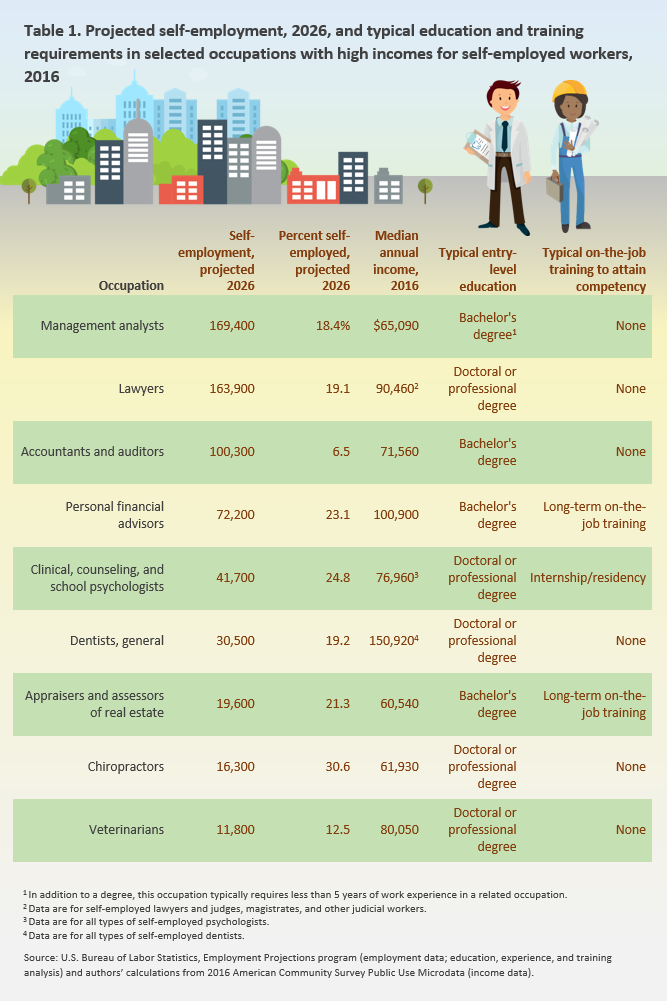
In all of the occupations in table 1, self-employed workers had a median annual income greater than $60,000 in 2016. That’s nearly twice $32,020, the median annual income for all self-employed workers. These high-income occupations for self-employed workers also are projected to have above-average rates of self-employment in 2026. Income data in the table were calculated from the U.S. Census Bureau’s American Community Survey.

Table 1. Projected self-employment, 2026, and typical education and training requirements in selected occupations with high incomes for self-employed workers, 2016
| Occupation |
Self-employment, projected 2026 |
Percent self-employed, projected 2026 |
Median annual income, 2016 |
Typical entry-level education |
Typical on-the-job training to attain competency |
|
Management analysts
|
169,400 |
18.4% |
$65,090 |
Bachelor's degree(1) |
None |
|
Lawyers
|
163,900 |
19.1 |
90,460(2) |
Doctoral or professional degree |
None |
|
Accountants and auditors
|
100,300 |
6.5 |
71,560 |
Bachelor's degree |
None |
|
Personal financial advisors
|
72,200 |
23.1 |
100,900 |
Bachelor's degree |
Long-term on-the-job training |
|
Clinical, counseling, and school psychologists
|
41,700 |
24.8 |
76,960(3) |
Doctoral or professional degree |
Internship/residency |
|
Dentists, general
|
30,500 |
19.2 |
150,920(4) |
Doctoral or professional degree |
None |
|
Appraisers and assessors of real estate
|
19,600 |
21.3 |
60,540 |
Bachelor's degree |
Long-term on-the-job training |
|
Chiropractors
|
16,300 |
30.6 |
61,930 |
Doctoral or professional degree |
None |
|
Veterinarians
|
11,800 |
12.5 |
80,050 |
Doctoral or professional degree |
None |
All of the occupations in table 1 typically require a bachelor’s, doctoral, or professional degree for entry. Nearly half of them also require people to have work experience in a related occupation in order to enter or require workers to get on-the-job training to attain competency.
Explore further
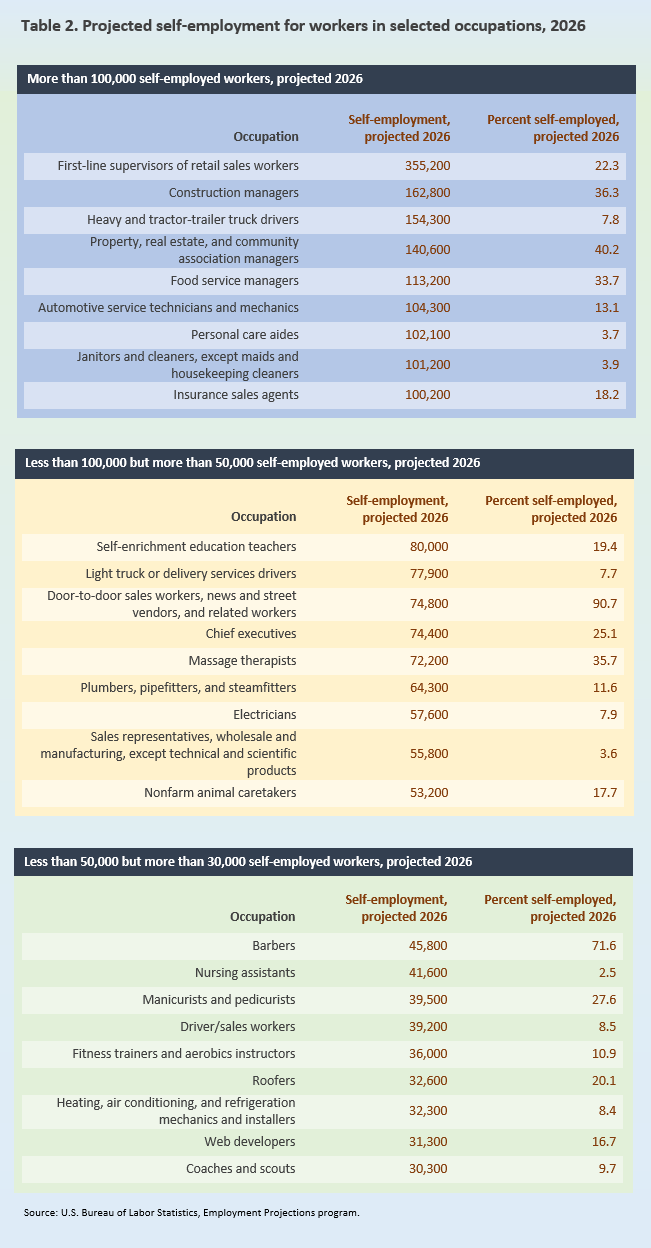
There are many options for self-employment. For more inspiration, see table 2 to find some other occupations in which BLS projects at least 30,000 self-employed workers in 2026.

Table 2. Projected self-employment for workers in selected occupations, 2026
More than 100,000 self-employed workers, projected 2026
| Occupation |
Self-employment, projected 2026 |
Percent self-employed, projected 2026 |
|
First-line supervisors of retail sales workers
|
355,200 |
22.3 |
|
Construction managers
|
162,800 |
36.3 |
|
Heavy and tractor-trailer truck drivers
|
154,300 |
7.8 |
|
Property, real estate, and community association managers
|
140,600 |
40.2 |
|
Food service managers
|
113,200 |
33.7 |
|
Automotive service technicians and mechanics
|
104,300 |
13.1 |
|
Personal care aides
|
102,100 |
3.7 |
|
Janitors and cleaners, except maids and housekeeping cleaners
|
101,200 |
3.9 |
|
Insurance sales agents
|
100,200 |
18.2 |
Less than 100,000 but more than 50,000 self-employed workers, projected 2026
| Occupation |
Self-employment, projected 2026 |
Percent self-employed, projected 2026 |
|
Self-enrichment education teachers
|
80,000 |
19.4 |
|
Light truck or delivery services drivers
|
77,900 |
7.7 |
|
Door-to-door sales workers, news and street vendors, and related workers
|
74,800 |
90.7 |
|
Chief executives
|
74,400 |
25.1 |
|
Massage therapists
|
72,200 |
35.7 |
|
Plumbers, pipefitters, and steamfitters
|
64,300 |
11.6 |
|
Electricians
|
57,600 |
7.9 |
|
Sales representatives, wholesale and manufacturing, except technical and scientific products
|
55,800 |
3.6 |
|
Nonfarm animal caretakers
|
53,200 |
17.7 |
Less than 50,000 but more than 30,000 self-employed workers, projected 2026
| Occupation |
Self-employment, projected 2026 |
Percent self-employed, projected 2026 |
|
Barbers
|
45,800 |
71.6 |
|
Nursing assistants
|
41,600 |
2.5 |
|
Manicurists and pedicurists
|
39,500 |
27.6 |
|
Driver/sales workers
|
39,200 |
8.5 |
|
Fitness trainers and aerobics instructors
|
36,000 |
10.9 |
|
Roofers
|
32,600 |
20.1 |
|
Heating, air conditioning, and refrigeration mechanics and installers
|
32,300 |
8.4 |
|
Web developers
|
31,300 |
16.7 |
|
Coaches and scouts
|
30,300 |
9.7 |
Learn about the occupations mentioned in this article, along with hundreds of others, in the Occupational Outlook Handbook (OOH). The OOH describes what workers do, what wage and salary workers are paid, what it takes to enter an occupation, and more.
Elka Torpey and Brian Roberts are economists in the Office of Occupational Statistics and Employment Projections, BLS. They can be reached at torpey.elka@bls.gov and roberts.brian@bls.gov.
Suggested citation:
Elka Torpey and Brian Roberts, "Small-business options: Occupational outlook for self-employed workers,"
Career Outlook,
U.S. Bureau of Labor Statistics,
May 2018.
 United States Department of Labor