An official website of the United States government
 United States Department of Labor
With the release of June 2021 indexes, the CPI program utilizes a secondary source dataset rather than traditional in-person or website collection for gasoline. In addition, the special relative index series for each type of gasoline, and the average price per gallon for gasoline (all types), are calculated and published monthly using the new source of price data.
The inclusion of these data in the CPI furthers the effort to improve index calculation by using new data sources and automated collection methods. Detailed comparisons of the past and new methodologies for the gasoline index follow
For several years, BLS has researched calculating price indexes for gasoline products based on secondary data sources and are now ready to replace the former data source with the new data source and index aggregation methodology. The secondary source data permit the use of substantially more observations with broader coverage of the CPI geography. Moreover, the price data are available, on a daily basis leading to improved estimates of average price levels for each calendar month. In addition to methodological improvements, these data also have the potential for cost savings and reduced respondent burden.
While the secondary source data have many advantages over the survey data collected by the BLS, incorporating it into the CPI required modifications to index calculation procedures. Traditional CPI methodology is not well-suited for leveraging several thousand observations per day for one item. An alternative aggregation methodology was developed to capitalize on the high-frequency, high volume price data. This methodology is described in detail in this conference paper: A Nontraditional Data Approach to the CPI Gasoline Index.
In response to feedback on the conference paper, methodology was refined by integrating county-level expenditure weights into the aggregation of price change within each component geographic index area. County to index area population proportions based on Census data and the Consumer Expenditure Survey expenditure weights for gasoline for each index area were used to create these estimates. The weighted price change now reflects county level differences, which provides more detailed geographic estimates of price change and variance.
An automatic collection system extracts a dataset from the secondary source on a daily basis. This dataset is uploaded into the CPI database for data cleaning, outlier removal, and preprocessing before index relative calculation. The zip code and state of each outlet is provided, then mapped to the CPI geography. All observations found in the dataset that are within the CPI geography are eligible and used for index relative calculation.
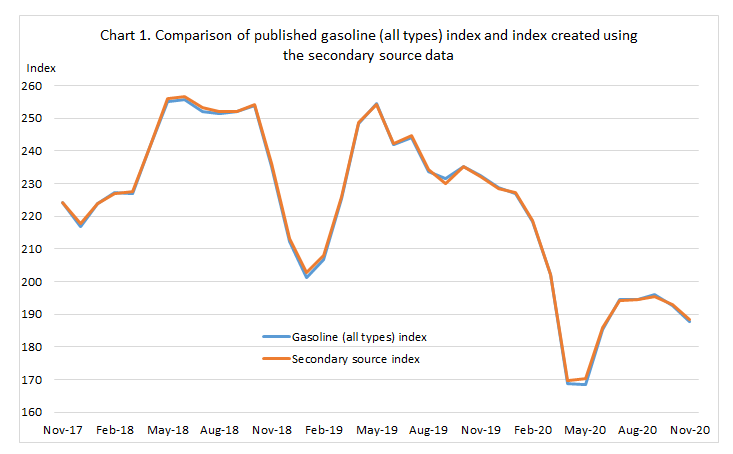
Though this source provides millions more observations than the traditionally collected CPI per month, it is not considered a census of all gasoline price observations. The observations are limited to those supplied by self-reports. Chart 1 shows the comparison of the indexes between the secondary data source and the published index for gasoline (all types).

The dataset includes the daily average price per gallon observed by the vendor’s users for a given fuel type at each outlet. In addition, the dataset includes fuel type, station ID number, and the number of valid reports that were used to create the daily average price. Prices include sales and excise taxes.
| Former CPI for Gasoline (survey data) | New CPI for Gasoline (secondary source) | |
|---|---|---|
|
Frequency |
Monthly | Daily |
|
Number of price observations |
4,000 price quotes/month | 6.1 million observations/month |
|
Number of retail outlets |
1,400 outlets/month | 91,272 stations/day |
|
Data characteristics |
Price, Type of service, Gasoline content, Octane level, Payment type, Special pricing, Brand name, Address, Collected throughout the month | Daily average price, Number of valid reports, Station ID, Zip code, State, Posted time |
When we have missing prices, item replacement is not conducted; we use cell relative imputation. Information on the cell-relative imputation method is available in the Calculation chapter of the CPI section of the Handbook of Methods.
Monthly primary sampling units (PSU) relatives are constructed based on comparing fuel type/station ID relatives in month t with month t-1 using the geometric mean price index formula with county allocated expenditure weights. Information on the geometric mean method is available in the Calculation chapter of the CPI section of the Handbook of Methods.
Prices:
Arithmetic mean unit price for each fuel type/station ID
Price Relatives:
Month-to-month change of same fuel type/station ID
No Item Replacement
Cell-Relative Imputation for Unavailable Fuel Type/Station ID
Weights:
County allocated expenditure weights based on biennial consumer gasoline expenditures and county population proportion relative to CPI PSU
Index Formula:
Geometric Mean with County Allocated Expenditure Weights
First, a Jevons relative (unweighted geometric mean) is calculated for all available fuel type/station ID relatives per county.
Next, a geometric mean is calculated for each CPI PSU, with each county within a given PSU receiving a county allocated expenditure weight.
Under the new CPI method for gasoline, an item-area is calculated using the weighted geometric mean of PSUs within a given area, where the weight is the summation of the county allocated expenditure weights of the all the counties within a PSU. The bi-annual weights are obtain from the Consumer Expenditure Survey. The price relatives are then used to update the basic item index. The aggregation of basic item-area indexes using a Laspeyres formula remains unchanged with the new methodology.
Calculations for each special relative series follow the geometric mean index calculation outlined above, while the average price for each fuel type is calculated using county average prices and county weights for each fuel type in a given PSU.
A brief overview of BLS research on current and future uses of alternative data sources is discussed in the Big Data in the U.S. Consumer Price Index: Experiences and Plans draft paper presented at the National Bureau of Economic Research Big Data for 21st Century Economic Statistics conference.
Last Modified Date: July 13, 2021