An official website of the United States government
An official website of the United States government
The .gov means it's official.
Federal government websites often end in .gov or .mil. Before sharing sensitive information,
make sure you're on a federal government site.
The site is secure.
The
https:// ensures that you are connecting to the official website and that any
information you provide is encrypted and transmitted securely.

Tossed around by the pulls and tugs of financial markets, stock market bid–ask spreads, the fees received by securities dealers who handle trades, are sensitive to peoples’ expectations of the future and are influenced by world events. Over the past decade, three prominent economic crises occurred—the 2008 financial crisis, the 2010 European sovereign debt crisis, and the 2011 U.S. debt-ceiling crisis. During the financial turmoil surrounding each event, bid–ask spreads and stock market volatility often moved similarly. This Beyond the Numbers article examines the relationship between the Bureau of Labor Statistics Producer Price Index (PPI) for dealer transactions-equity securities and two major stock market volatility indicators. An analysis of these three measures shows a positive correlation. This means that when the market volatility indexes increase, the PPI for dealer transactions-equity securities also tends to increase.1
Securities dealer fees, also known as bid–ask spreads, or “spreads” for short, along with broker fees, are the two major fees that investors pay when buying and selling stocks. Broker fees are typically a fixed fee per trade paid to an intermediary to sell or buy stock in a company. In contrast, spreads are dependent on a number of different market and economic factors, and their cost is variable. Securities dealers, also known as market makers, collect the bid–ask spread. The spread is the difference between the bid price, or the price the market maker is willing to pay to purchase a stock, and the ask price, the price the market maker will sell the same stock at the same time. Although the spread between the bid price and the ask price is usually small, it adds up to a large amount of money in aggregate.
A market maker assures that securities investors can purchase or sell a particular stock when they want. By guaranteeing this flexibility, market makers assume risk and collect the bid–ask spread for doing so. When markets are volatile, a stock price may change frequently, increasing the chance a dealer may lose money. A dealer may lose money on a buy (bid) side transaction, for example, if the market price of a stock falls below the price at which a dealer offered to buy. A dealer may lose money on a sell (ask) side transaction if the market price of a stock rises above the price at which the dealer offered to sell. To account for the risk of pricing on the wrong side of the market, securities dealers closely follow market volatility and typically receive larger spreads when prices are volatile.
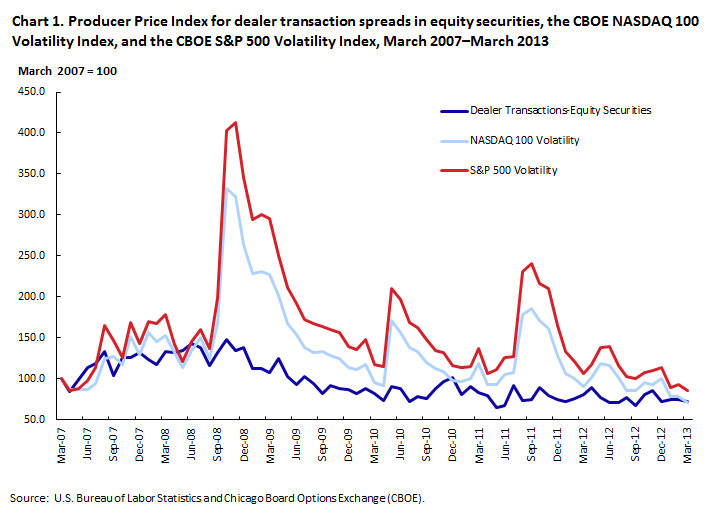
One method of observing how severe economic events influence the size of spreads is by examining how the two factors relate to each other at a market level. Comparing the PPI for dealer transactions-equity securities, which measures the average change in securities dealer fees by tracking spreads for stocks traded on U.S. markets, to measures of market volatility shows a relationship. The two measures of market volatility used in this comparison are the average monthly changes in the CBOE NASDAQ-100 Volatility Index (a measure of volatility for the NASDAQ exchange) and the CBOE Volatility Index (a measure of volatility for the S&P 500 index). To differentiate it from the NASDAQ measure of volatility, this article refers to the latter measure as the S&P volatility index.2 Chart 1 shows the trends in the PPI for dealer transactions-equity securities, along with the two volatility indexes, covering the span of years that includes all three financial crises.
Market forces, such as the volume of shares traded or the total value of a stock exchange or index, affect these measures of volatility and price. However, other forces also can influence their breadth. The main difference between the PPI and the volatility indexes is the makeup of the indexes themselves. The PPI for dealer transactions-equity securities broadly covers the changes in spreads relating to stocks traded on major American exchanges. However, the NASDAQ-100 Volatility Index only includes the top-100 listed companies on the NASDAQ exchange. The S&P 500 Volatility Index covers companies listed on both exchanges but weights them differently than either the NASDAQ or PPI. Because of these differences, the PPI and the market volatility indexes may not always move similarly.
In early 2007, uncertainty spread within the banking sector. The mortgage default rate was on the rise, resulting in some subprime mortgage lenders filing for bankruptcy.3 Among these lenders was New Century Financial, a well-known company whose bankruptcy was one of the first signs of market turbulence in April 2007.4 Following the collapse of New Century, many large banks suffered record losses as market liquidity dried up. A growing crisis seemed around the corner. In the fall of 2007, a British bank, Northern Rock, requested emergency funding from the Bank of England, and in March 2008, liquidity problems forced Bear Sterns to merge with J.P. Morgan Chase.5 During this period, the distressed mortgage market disrupted the banking system, leading to one of the most volatile periods for U.S. financial markets since the Great Depression.
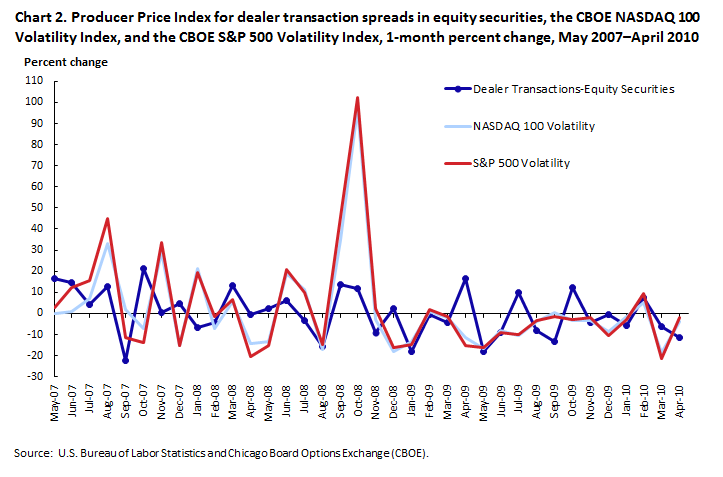
As this financial crisis took shape, spreads and market volatility deviated from historical norms. From April 2007 to August 2008, a period of unstable prices and rising volatility resulted in the PPI for dealer transactions-equity securities increasing 37.6 percent, while the NASDAQ-100 Volatility Index climbed 43.7 percent, and the S&P Volatility Index rose 60.1 percent over the period.6 This trend signaled a shift in direction for stock markets. In response to uncertainty regarding the health of banks and bank stocks, both spreads and volatility increased—a trend that would continue over the next year as the financial sector distress extended to the wider economy. (See chart 2.)
Of particular interest, in September and October 2008 both financial market spreads and volatility spiked in reaction to effects of the subprime mortgage crisis, which included the U.S. government takeover of Fannie Mae and Freddie Mac and the collapse of Lehman Brothers in September 2008.7 From August to October, the PPI for dealer transactions-equity securities, the NASDAQ 100 Volatility Index, and the S&P Volatility Index increased 26.9 percent, 166.3 percent, and 195.6 percent, respectively, reaching their highest levels in 5 years.8
As the financial crisis ended in 2009, both spreads and volatility declined in a similar fashion. Between June 2009 and April 2010, the PPI for dealer transactions-equity securities, the NASDAQ 100 Volatility Index, and the S&P Volatility Index decreased 21.6 percent, 40.4 percent, and 40.2 percent, respectively.9
After a 2-year decline in volatility and spreads, another critical situation developed. The European sovereign debt crisis took shape in 2009 and 2010 following the collapse of Iceland’s banking system in late 2008. Spillover from the Great Recession in the United States also was viewed as a contributing factor.10 During this time, many lenders grew concerned about the ability of several European national banks to repay their debts. To compensate for their higher risk of default, lenders demanded higher interest rates from European countries with high debt and deficit levels.11 Working with less money, financially distressed European countries resorted to cutting deficits and raising taxes in an effort to raise revenue. This in turn led to social unrest and diminished investor confidence in the ability of countries to repay debt.12
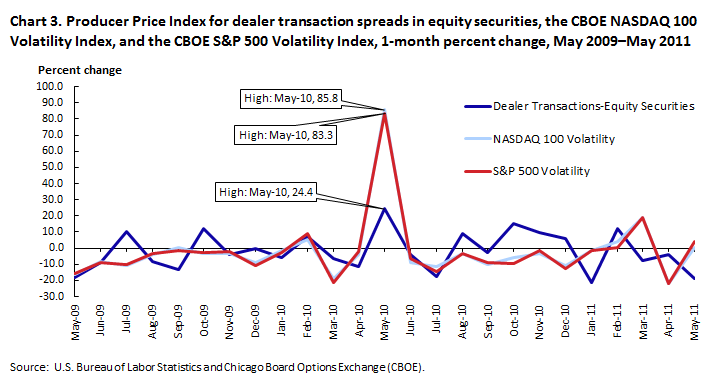
As this debt crisis unfolded, European turmoil spilled over to U.S. markets and caused spreads for U.S. stocks to spike again. In May 2010, the PPI for dealer transactions-equity securities increased 24.4 percent, the third-largest advance since the inception of the index in 2006. This coincided with the NASDAQ-100 Volatility Index jumping 85.8 percent and the S&P Volatility Index rising 83.3 percent, the second-largest monthly increases on record for both indexes. (See chart 3.)
These results further demonstrate the link between world financial markets and the volatility of U.S. equities. As European governments struggled to reduce record levels of debt, the corresponding increase in the PPI demonstrated that U.S. investors were paying higher prices to enter or exit financial markets. Volatility, stemming from uncertainty about European banks during this crisis, affected expectations of U.S. companies. Consequently, spreads for stocks on U.S. exchanges expanded.
In 2011, another market-influencing event unfolded. In the middle of the year, the legislative and executive branches of the U.S. government were unable to agree on terms to raise the debt ceiling—a legislative limit on the amount of national debt that the U.S. Treasury can issue.13 This situation was without precedent; investors grew concerned about the U.S. government’s ability to repay its creditors after August 2, 2011, the date the U.S. Treasury estimated it would run out of money.14 Although an agreement was eventually signed on July 31, the political brinksmanship ensnared financial markets, leading to the first-ever credit downgrade for the United States.15
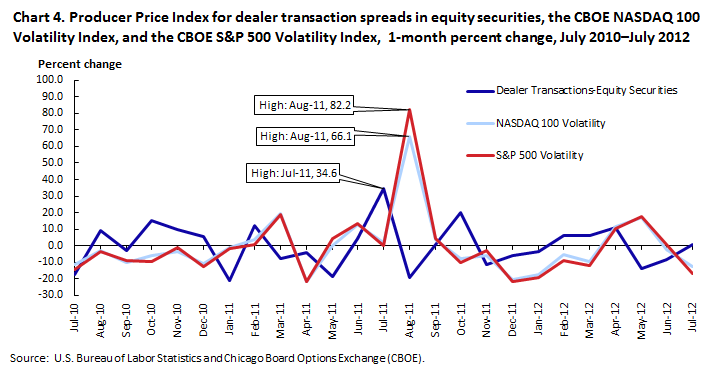
This chain of events initiated the most volatile week for financial markets since the financial crisis of 2008. In July and August 2011, market volatility and spreads increased abruptly. In July 2011, the PPI for dealer transactions-equity securities rose 34.6 percent.16 In August 2011, the NASDAQ-100 Volatility Index increased 66.1 percent and the S&P Volatility Index increased 82.2 percent—their largest advances in over a year and the third largest gains since their inception.17 (See chart 4.)
During this dispute, as the deadline drew nearer and no agreement was in sight, market volatility increased and investors paid more to trade on U.S. markets as spreads expanded. Even though the source of the disagreement was political rather than financial, the consequence for investors was the same—uncertainty about the economy made it more expensive to trade on U.S. exchanges.
Uncertainty about the direction of the financial markets affects the value of stocks and the costs to trade them. During economic crises, securities dealers inflate spreads to account for higher risk, driving up the cost of trading when share prices are usually falling. Although market volatility tends to affect spreads less than other variables when markets are calm, it often has a greater effect on them when markets are volatile. An understanding of this dynamic can help investors better anticipate how spreads will change in the future and can perhaps help them avoid paying more when trading securities.
This Beyond the Numbers article was prepared by Jason Wrobel. For additional information, you may contact Brett R. Matsumoto, research economist in the Office of Prices and Living Conditions, U.S. Bureau of Labor Statistics. Email: matsumoto.brett@bls.gov. Telephone: (202) 691-6575.
Information in this article will be made available upon request to individuals with sensory impairments. Voice phone: (202) 691-5200. Federal Relay Service: 1-800-877-8339. This article is in the public domain and may be reproduced without permission
Jason Wrobel, “The cost of crisis: why stock fees rise when markets slip,” Beyond the Numbers: Prices & Spending, vol. 6, no. 3 (U.S. Bureau of Labor Statistics, February 2017), https://www.bls.gov/opub/btn/volume-6/cost-of-crisis.htm
1The correlation coefficient between the PPI and the NASDAQ Volatility Index is 0.53; the correlation coefficient between the PPI and the S&P Volatility Index is 0.46.
2 This article compares the PPI tracking changes in prices for dealer transaction activities for equity securities with the NASDAQ volatility index because the NASDAQ exchange is the second largest exchange in the United States by market capitalization. The S&P 500 volatility index is the best indicator for gauging volatility on the New York Stock Exchange (NYSE), the biggest exchange in the United States by market capitalization. This analysis excludes other U.S. exchanges because they make up a much smaller portion of the market and do not have volatility indexes. See http://www.cboe.com/micro/vix/faq.aspx and http://www.cboe.com/micro/vxn/ for more information.
3 “The Origins of the Financial Crisis: Crash course,” The Economist, September 7, 2013, http://www.economist.com/news/schoolsbrief/21584534effects-financial-crisis-are-still-being-felt-five-years-article.
4 Michael Corkery, James R. Hagerty, Ruth Simon, and Gregory Zuckerman, “At a Mortgage Lender, Rapid Rise, Faster Fall,” The Wall Street Journal, March 12, 2007, http://www.wsj.com/articles/SB117366027973133733.
5 “The Origins of the Financial Crisis: Crash course,” The Economist, September 7, 2013, http://www.economist.com/news/schoolsbrief/21584534-effects-financial-crisis-are-still-being-felt-five-years-article.
6 To obtain the PPI data for investment banking and securities dealing, dealer transactions, equity securities link to https://data.bls.gov/timeseries/pcu523110523110201. Data for the NASDAQ VXN Volatility Index is available by linking to Yahoo Finance at http://finance.yahoo.com/quote/%5EVXN/history. Data for the S&P VIX Volatility Index is available by linking to http://finance.yahoo.com/quote/%5EVIX/historyS&P.
7 79th Annual Report, (Bank for International Settlements, June 29, 2009), pp. 23–24, http://www.bis.org/publ/arpdf/ar2009e2.pdf.
8 See NASDAQ VXN Volatility Index at Yahoo Finance, http://finance.yahoo.com/quote/%5EVXN/history, and S&P VIX Volatility Index at Yahoo Finance, http://finance.yahoo.com/quote/%5EVIX/history.
9 Ibid.
10 Alexander Elchler, “The European Debt Crisis: A Beginner’s Guide,” Huffington Post, December 21, 2011,
http://www.huffingtonpost.com/2011/12/21/european-debt-crisis_n_1147173.html.
11 “Why did the Crisis Spread?” European Economy Explained (European Commission, September 4, 2014).
12 79th Annual Report, (Bank for International Settlements, June 29, 2009), pp. 23–24, http://www.bis.org/publ/arpdf/ar2009e2.pdf. Also, see “European Day of Action: Anti-Austerity Protests Spark Violence,” Spiegel Online, November 14, 2012. http://www.spiegel.de/international/europe/anti-austerity-protests-spark-violence-in-european-countries-a-867316.html.
13 Debt Limit: Analysis of 2011–2012 Actions Taken and Effect of Delayed Increase on Borrowing Costs, GAO-12-701 (United States Government Accountability Office, July 2012), p. 2, http://www.gao.gov/assets/600/592832.pdf.
14 Neil Irwin, “Markets plummet on global economic fears,” The Washington Post, August 5, 2011, https://www.washingtonpost.com/business/economy/markets-plummet-on-global-economic-fears/2011/08/04/gIQALFdBvI_story.html?utm_term=.e2a52e3a952b.
15 Dan Arnall, Michael S. James, Susanna Kim, Steven Portnoy, and Jake Tapper, “Standard & Poor's Downgrades US Credit Rating From AAA to AA+,” ABC News, August 5, 2011, http://abcnews.go.com/Business/standard-poors-downgrades-us-credit-rating-aaa-aa/story?id=14220820.
16 “Producer Price Index: Investment banking and securities dealing, Dealer transactions, equity securities” (U.S. Bureau of Labor Statistics, May 2016), https://data.bls.gov/timeseries/pcu523110523110201.
17 Data for the NASDAQ VXN Volatility Index is available by linking to Yahoo Finance at http://finance.yahoo.com/quote/%5EVXN/history, and data for the S&P VIX Volatility Index is available by linking to http://finance.yahoo.com/quote/%5EVIX/historyS&P.
Publish Date: Monday, February 6, 2017