An official website of the United States government
 United States Department of Labor
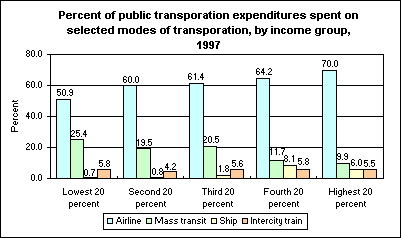
Although households in all income groups allocated over half of their public transportation expenditures to airfare in 1997, the proportion spent on airfare varied markedly among income groups.

[Chart data—TXT]
For the five groups shown in the chart, the share of public transportation expenditures that went to air travel ranged from 51 percent for the lowest income group to 70 percent for the highest. There was also much variation in the share spent on mass transit—the lowest income group allocated 25 percent of public transportation expenditures to this in 1997, while the highest income group allocated just 10 percent.
One category with a small amount of variation among income groups was train travel. The share of spending that went to intercity train travel only ranged from 4.2 percent to 5.8 percent among the groups.
These data are a product of the BLS Consumer Expenditure Survey program. Additional information is available from "Issues in Labor Statistics: Expenditures on Public Transportation" (PDF 16K).
Bureau of Labor Statistics, U.S. Department of Labor, The Economics Daily, Income and public transportation expenditures at https://www.bls.gov/opub/ted/1999/oct/wk1/art05.htm (visited December 13, 2025).

