An official website of the United States government
 United States Department of Labor
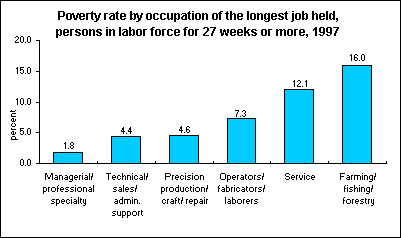
In 1997, workers in service occupations and agricultural jobs had double-digit poverty rates. The poverty rate for service workers was 12.1 percent while the rate for workers in farming, forestry, and fishing was 16.0 percent.

[Chart data—TXT]
Workers in other occupations had poverty rates below 10 percent. The proportion living below the poverty level ranged from just 1.8 percent for persons in managerial and professional specialty occupations to 7.3 percent for persons working as operators, fabricators, and laborers.
Poverty rates varied within the major occupational groups, especially within service occupations. For private household workers, the poverty rate in 1997 was 22.3 percent, and for protective service workers it was 3.1 percent. Among all other workers in service occupations (such as waiters and waitresses, dental assistants, janitors, and beauticians), 13.0 percent lived below the poverty level.
These data on poverty rates are from the Current Population Survey. The above figures are for individuals who spent at least 27 weeks in the labor force in 1997. Find out more in "A Profile of the Working Poor, 1997," BLS Report 936.
Bureau of Labor Statistics, U.S. Department of Labor, The Economics Daily, Service, farm workers have highest poverty rates at https://www.bls.gov/opub/ted/1999/sept/wk2/art01.htm (visited July 12, 2025).

