An official website of the United States government
An official website of the United States government
The .gov means it's official.
Federal government websites often end in .gov or .mil. Before sharing sensitive information,
make sure you're on a federal government site.
The site is secure.
The
https:// ensures that you are connecting to the official website and that any
information you provide is encrypted and transmitted securely.
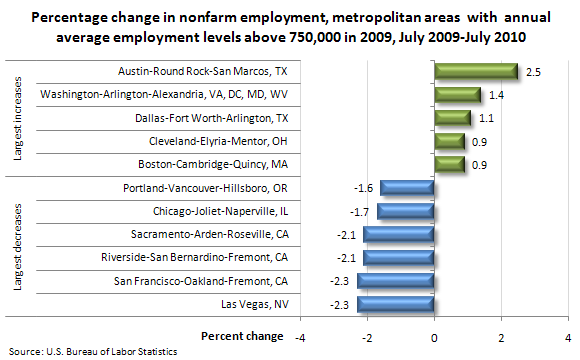
From July 2009 to July 2010, nonfarm employment decreased in 25 of the 36 metropolitan areas with annual average employment levels above 750,000 in 2009.
The large metropolitan area that reported the biggest over-the-year percentage increase in employment was Austin-Round Rock-San Marcos, Texas (+2.5 percent), followed by Washington-Arlington-Alexandria, Virginia-D.C.-Maryland-West Virginia. (1.4 percent) and Dallas-Fort Worth-Arlington, Texas (+1.1 percent).
The largest over-the-year percentage decreases in employment in large metropolitan areas were posted in Las Vegas, Nevada and San Francisco-Oakland-Fremont, California (‑2.3 percent each), and Riverside-San Bernardino-Ontario, California, and Sacramento-Arden-Arcade-Roseville, California (‑2.1 percent each).
These data are from the Current Employment Statistics (State and Metropolitan Area) program. July 2010 employment data are preliminary and subject to revision. To learn more, see "Metropolitan Area Employment and Unemployment — July 2010" (HTML) (PDF), news release USDL-10-1210.
Bureau of Labor Statistics, U.S. Department of Labor, The Economics Daily, Metropolitan area employment, July 2010 at https://www.bls.gov/opub/ted/2010/ted_20100908.htm (visited July 12, 2025).