An official website of the United States government
An official website of the United States government
The .gov means it's official.
Federal government websites often end in .gov or .mil. Before sharing sensitive information,
make sure you're on a federal government site.
The site is secure.
The
https:// ensures that you are connecting to the official website and that any
information you provide is encrypted and transmitted securely.
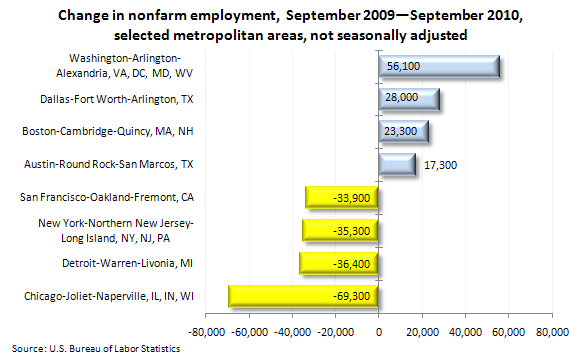
The largest over-the-year increase in employment from September 2009 to September 2010 occurred in Washington-Arlington-Alexandria, D.C.-Virginia-Maryland-West Virginia (+56,100), followed by Dallas-Fort Worth-Arlington, Texas (+28,000), Boston-Cambridge-Quincy, Massachusetts-New Hampshire (+23,300) and Austin-Round Rock-San Marcos, Texas (+17,300).
The largest over-the-year employment decrease was recorded in Chicago-Joliet-Naperville, Illinois-Indiana-Wisconsin (‑69,300), followed by Detroit-Warren-Livonia, Michigan (‑36,400), New York-Northern New Jersey-Long Island, New York-New Jersey-Pennsylvania (‑35,300), and San Francisco-Oakland-Fremont, California (‑33,900).
In September 2010, 193 metropolitan areas reported over-the-year decreases in nonfarm employment, 168 reported increases, and 11 had no change.
The data are from the Current Employment Statistics (State and Metro Area) program. The most recent month’s data are preliminary and subject to revision. To learn more, see "Metropolitan Area Employment and Unemployment — September 2010" (HTML) (PDF), news release USDL-10-1517.
Bureau of Labor Statistics, U.S. Department of Labor, The Economics Daily, Metropolitan area employment, September 2010 at https://www.bls.gov/opub/ted/2010/ted_20101104.htm (visited July 12, 2025).