
An official website of the United States government
An official website of the United States government
The .gov means it's official.
Federal government websites often end in .gov or .mil. Before sharing sensitive information,
make sure you're on a federal government site.
The site is secure.
The
https:// ensures that you are connecting to the official website and that any
information you provide is encrypted and transmitted securely.
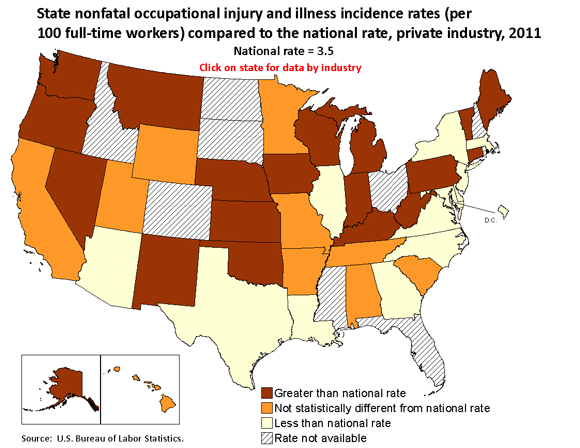
In 2011, the total recordable case (TRC) injury and illness incidence rates were higher in 19 states than the national rate of 3.5 cases per 100 full-time workers, lower than the national rate in 12 states and in the District of Columbia, and not statistically different from the national rate in 10 states. Data for establishments in the nine states for which individual estimates are unavailable are collected by BLS regional offices and used solely for the tabulation of national estimates.
| State | Injury and illness rate (per 100 full-time workers) | Compared to national rate of 3.5 (per 100 full-time workers) |
|---|---|---|
Alabama | 3.7 | Not statistically different from national rate |
Alaska | 4.5 | Greater than national rate |
Arizona | 3.2 | Less than national rate |
Arkansas | 3.4 | Not statistically different from national rate |
California | 3.5 | Not statistically different from national rate |
Colorado | Data not available | Data not available |
Connecticut | 4.5 | Greater than national rate |
Delaware | 2.9 | Less than national rate |
District of Columbia | 1.9 | Less than national rate |
Florida | Data not available | Data not available |
Georgia | 2.9 | Less than national rate |
Hawaii | 3.5 | Not statistically different from national rate |
Idaho | Data not available | Data not available |
Illinois | 3.2 | Less than national rate |
Indiana | 4.2 | Greater than national rate |
Iowa | 4.3 | Greater than national rate |
Kansas | 3.9 | Greater than national rate |
Kentucky | 4.2 | Greater than national rate |
Louisiana | 2.5 | Less than national rate |
Maine | 5.7 | Greater than national rate |
Maryland | 3.0 | Less than national rate |
Massachusetts | 3.2 | Less than national rate |
Michigan | 3.8 | Greater than national rate |
Minnesota | 3.7 | Not statistically different from national rate |
Mississippi | Data not available | Data not available |
Missouri | 3.4 | Not statistically different from national rate |
Montana | 5.0 | Greater than national rate |
Nebraska | 3.9 | Greater than national rate |
Nevada | 3.9 | Greater than national rate |
New Hampshire | Data not available | Data not available |
New Jersey | 3.0 | Less than national rate |
New Mexico | 4.2 | Greater than national rate |
New York | 2.9 | Less than national rate |
North Carolina | 3.1 | Less than national rate |
North Dakota | Data not available | Data not available |
Ohio | Data not available | Data not available |
Oklahoma | 3.9 | Greater than national rate |
Oregon | 3.8 | Greater than national rate |
Pennsylvania | 4.1 | Greater than national rate |
Rhode Island | Data not available | Data not available |
South Carolina | 3.3 | Not statistically different from national rate |
South Dakota | Data not available | Data not available |
Tennessee | 3.5 | Not statistically different from national rate |
Texas | 2.7 | Less than national rate |
Utah | 3.6 | Not statistically different from national rate |
Vermont | 5.0 | Greater than national rate |
Virginia | 2.9 | Less than national rate |
Washington | 4.9 | Greater than national rate |
West Virginia | 3.9 | Greater than national rate |
Wisconsin | 4.2 | Greater than national rate |
Wyoming | 3.6 | Not statistically different from national rate |
Among those states for which 2011 data are available, Maine recorded the highest injury and illness incidence rate at 5.7 per 100 full-time workers. The District of Columbia registered the lowest rate at 1.9. Differences in the composition of industries within each state account for some of the differences across states.
Compared with 2010, private industry TRC incidence rates among the 41 states and the District of Columbia for which estimates are available in 2011 declined in 7 states, rose in 1 state, and remained statistically unchanged in 32 states and in the District of Columbia (estimates for Pennsylvania for 2010 were not available for comparison).
These data are from the Injuries, Illnesses, and Fatalities program. To learn more, see "Workplace Injuries and Illnesses — 2011" (HTML) (PDF), news release USDL‑12‑2121.
Bureau of Labor Statistics, U.S. Department of Labor, The Economics Daily, State nonfatal occupational injury and illness incidence rates, private industry, 2011 at https://www.bls.gov/opub/ted/2012/ted_20121205.htm (visited July 12, 2025).

