
An official website of the United States government
An official website of the United States government
The .gov means it's official.
Federal government websites often end in .gov or .mil. Before sharing sensitive information,
make sure you're on a federal government site.
The site is secure.
The
https:// ensures that you are connecting to the official website and that any
information you provide is encrypted and transmitted securely.
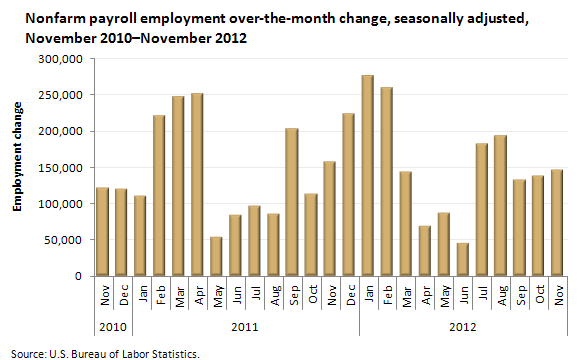
In November, total nonfarm payroll employment increased by 146,000. Since the beginning of this year, employment growth has averaged 151,000 per month, about the same as the average monthly job gain of 153,000 in 2011.
| Month | Employment change |
|---|---|
Nov 2010 | 121,000 |
Dec 2010 | 120,000 |
Jan 2011 | 110,000 |
Feb 2011 | 220,000 |
Mar 2011 | 246,000 |
Apr 2011 | 251,000 |
May 2011 | 54,000 |
Jun 2011 | 84,000 |
Jul 2011 | 96,000 |
Aug 2011 | 85,000 |
Sep 2011 | 202,000 |
Oct 2011 | 112,000 |
Nov 2011 | 157,000 |
Dec 2011 | 223,000 |
Jan 2012 | 275,000 |
Feb 2012 | 259,000 |
Mar 2012 | 143,000 |
Apr 2012 | 68,000 |
May 2012 | 87,000 |
Jun 2012 | 45,000 |
Jul 2012 | 181,000 |
Aug 2012 | 192,000 |
Sep 2012 | 132,000 |
Oct 2012 | 138,000(p) |
Nov 2012 | 146,000(p) |
Footnotes: | |
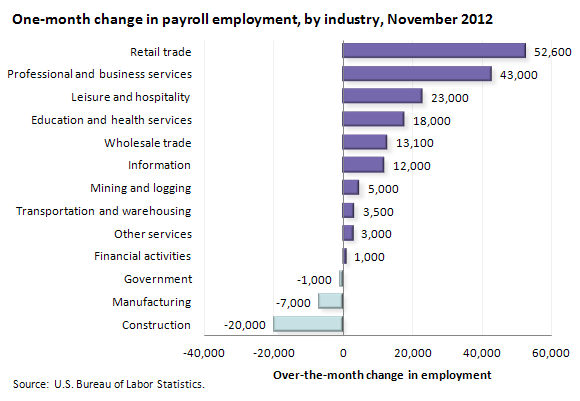
Retail trade employment rose by 53,000 in November and has increased by 140,000 over the past 3 months. Over the month, job gains occurred in clothing and clothing accessory stores (+33,000), in general merchandise stores (+10,000), and in electronics and appliance stores (+9,000). Employment in miscellaneous store retailers decreased by 13,000.
In November, employment in professional and business services rose by 43,000. Employment continued to increase in computer systems design and related services.
| Industry | Change in payroll employment (p) |
|---|---|
Retail trade | 52,600 |
Professional and business services | 43,000 |
Leisure and hospitality | 23,000 |
Education and health services | 18,000 |
Wholesale trade | 13,100 |
Information | 12,000 |
Mining and logging | 5,000 |
Transportation and warehousing | 3,500 |
Other services | 3,000 |
Financial activities | 1,000 |
Government | -1,000 |
Manufacturing | -7,000 |
Construction | -20,000 |
Footnotes: | |
Health care (part of education and health services) employment continued to increase in November (+20,000), with gains in hospitals (+8,000) and in nursing care facilities (+5,000). Health care has added an average of 26,000 jobs per month this year.
Employment in construction declined by 20,000 in November, with much of the loss occurring in construction of buildings (−11,000).
Manufacturing employment changed little over the month. Within the industry, job losses in food manufacturing (−12,000) and chemicals (−9,000) more than offset gains in motor vehicles and parts (+10,000) and wood products (+3,000).
These data are from the Current Employment Statistics (CES) program and are seasonally adjusted. Data for the most recent two months are preliminary. To learn more, see "The Employment Situation — November 2012," (HTML) (PDF) news release USDL-12-2366. More charts featuring CES employment data can be found in Current Employment Statistics Highlights: November 2012 (PDF).
Bureau of Labor Statistics, U.S. Department of Labor, The Economics Daily, Payroll employment increases in November 2012 at https://www.bls.gov/opub/ted/2012/ted_20121210.htm (visited September 19, 2024).

