An official website of the United States government
 United States Department of Labor
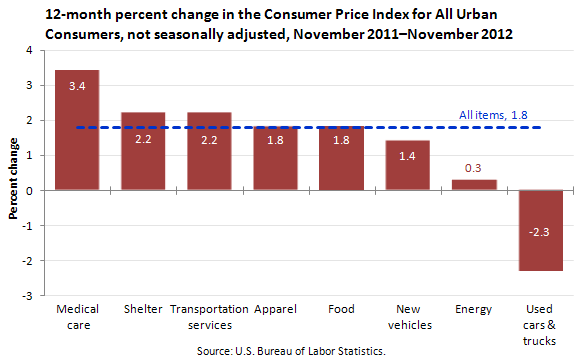
The Consumer Price Index for All Urban Consumers increased 1.8 percent from November 2011 to November 2012.

| Expenditure category | Percent change |
|---|---|
All items | 1.8 |
Medical care | 3.4 |
Shelter | 2.2 |
Transportation services | 2.2 |
Apparel | 1.8 |
Food | 1.8 |
New vehicles | 1.4 |
Energy | 0.3 |
Used cars and trucks | -2.3 |
The index for all items less food and energy rose 1.9 percent over the last 12 months; the food index rose 1.8 percent, and the energy index rose 0.3 percent.
The index for medical care increased 3.4 percent from November 2011 to November 2012, and the indexes for shelter and for transportation services each rose 2.2 percent. The apparel index rose 1.8 percent over the year.
The Consumer Price Index for new vehicles rose 1.4 percent from November 2011 to November 2012, while the index for used cars and trucks fell 2.3 percent over the year.
These data are from the BLS Consumer Price Index program. To learn more, see "Consumer Price Index — November 2012" (HTML) (PDF), news release USDL‑12‑2408.
Bureau of Labor Statistics, U.S. Department of Labor, The Economics Daily, Consumer Price Index, November 2011 to November 2012 at https://www.bls.gov/opub/ted/2012/ted_20121217.htm (visited July 12, 2025).

