
An official website of the United States government
An official website of the United States government
The .gov means it's official.
Federal government websites often end in .gov or .mil. Before sharing sensitive information,
make sure you're on a federal government site.
The site is secure.
The
https:// ensures that you are connecting to the official website and that any
information you provide is encrypted and transmitted securely.
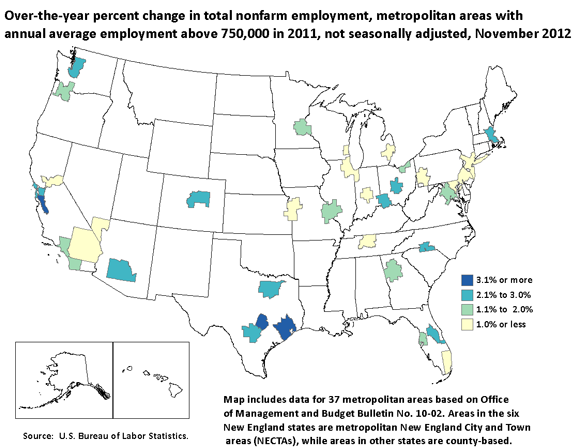
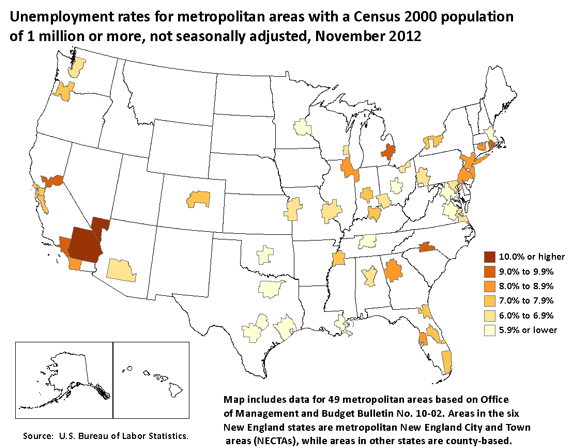
From November 2011 to November 2012, nonfarm employment rose in all 37 metropolitan areas with annual average employment levels above 750,000 in 2011. Among the 49 metropolitan areas with a Census 2000 population of 1 million or more, 41 reported over-the-year unemployment rate decreases, 6 registered increases, and 2 had no change.
| Area | Percent change (p) |
|---|---|
Austin-Round Rock-San Marcos, TX Metropolitan Statistical Area | 4.4 |
San Jose-Sunnyvale-Santa Clara, CA Metropolitan Statistical Area | 3.7 |
Houston-Sugar Land-Baytown, TX Metropolitan Statistical Area | 3.2 |
Phoenix-Mesa-Glendale, AZ Metropolitan Statistical Area | 2.9 |
Denver-Aurora-Broomfield, CO Metropolitan Statistical Area | 2.8 |
Charlotte-Gastonia-Rock Hill, NC-SC Metropolitan Statistical Area | 2.7 |
San Francisco-Oakland-Fremont, CA Metropolitan Statistical Area | 2.7 |
Seattle-Tacoma-Bellevue, WA Metropolitan Statistical Area | 2.7 |
Dallas-Fort Worth-Arlington, TX Metropolitan Statistical Area | 2.5 |
San Antonio-New Braunfels, TX Metropolitan Statistical Area | 2.5 |
Cincinnati-Middletown, OH-KY-IN Metropolitan Statistical Area | 2.4 |
Boston-Cambridge-Quincy, MA-NH Metropolitan NECTA | 2.1 |
Columbus, OH Metropolitan Statistical Area | 2.1 |
Orlando-Kissimmee-Sanford, FL Metropolitan Statistical Area | 2.1 |
San Diego-Carlsbad-San Marcos, CA Metropolitan Statistical Area | 2.0 |
Tampa-St. Petersburg-Clearwater, FL Metropolitan Statistical Area | 2.0 |
Minneapolis-St. Paul-Bloomington, MN-WI Metropolitan Statistical Area | 1.7 |
Los Angeles-Long Beach-Santa Ana, CA Metropolitan Statistical Area | 1.6 |
Atlanta-Sandy Springs-Marietta, GA Metropolitan Statistical Area | 1.5 |
Portland-Vancouver-Hillsboro, OR-WA Metropolitan Statistical Area | 1.5 |
Cleveland-Elyria-Mentor, OH Metropolitan Statistical Area | 1.1 |
St. Louis, MO-IL Metropolitan Statistical Area | 1.1 |
Washington-Arlington-Alexandria, DC-VA-MD-WV Metropolitan Statistical Area | 1.1 |
Riverside-San Bernardino-Ontario, CA Metropolitan Statistical Area | 1.0 |
Chicago-Joliet-Naperville, IL-IN-WI Metropolitan Statistical Area | 0.9 |
Indianapolis-Carmel, IN Metropolitan Statistical Area | 0.9 |
Philadelphia-Camden-Wilmington, PA-NJ-DE-MD Metropolitan Statistical Area | 0.9 |
Las Vegas-Paradise, NV Metropolitan Statistical Area | 0.8 |
New York-Northern New Jersey-Long Island, NY-NJ-PA Metropolitan Statistical Area | 0.8 |
Detroit-Warren-Livonia, MI Metropolitan Statistical Area | 0.7 |
Pittsburgh, PA Metropolitan Statistical Area | 0.7 |
Sacramento--Arden-Arcade--Roseville, CA Metropolitan Statistical Area | 0.7 |
Miami-Fort Lauderdale-Pompano Beach, FL Metropolitan Statistical Area | 0.6 |
Baltimore-Towson, MD Metropolitan Statistical Area | 0.5 |
Nashville-Davidson--Murfreesboro--Franklin, TN Metropolitan Statistical Area | 0.5 |
Kansas City, MO-KS Metropolitan Statistical Area | 0.2 |
Milwaukee-Waukesha-West Allis, WI Metropolitan Statistical Area | 0.2 |
Footnotes: | |
In November 2012, the largest over-the-year percentage increases in employment among large metropolitan areas were posted in Austin-Round Rock-San Marcos, Texas (+4.4 percent), San Jose-Sunnyvale-Santa Clara, California (+3.7 percent), and Houston-Sugar Land-Baytown, Texas (+3.2 percent). The smallest increases were registered by Kansas City, Missouri-Kansas, and Milwaukee-Waukesha-West Allis, Wisconsin (+0.2 percent each).
Among large areas, the highest unemployment rate in November 2012 was registered in Riverside-San Bernardino-Ontario, California, 11.3 percent. The lowest jobless rates among the large areas were recorded in Oklahoma City, Oklahoma, and New Orleans-Metairie-Kenner, Louisiana, 4.5 and 4.7 percent, respectively.
| Area | Unemployment rate (in percent) (p) |
|---|---|
Riverside-San Bernardino-Ontario, CA Metropolitan Statistical Area | 11.3 |
Las Vegas-Paradise, NV Metropolitan Statistical Area | 10.4 |
Providence-Fall River-Warwick, RI-MA Metropolitan NECTA | 9.9 |
Sacramento--Arden-Arcade--Roseville, CA Metropolitan Statistical Area | 9.8 |
Detroit-Warren-Livonia, MI Metropolitan Statistical Area | 9.7 |
Los Angeles-Long Beach-Santa Ana, CA Metropolitan Statistical Area | 9.1 |
Charlotte-Gastonia-Rock Hill, NC-SC Metropolitan Statistical Area | 9.0 |
New York-Northern New Jersey-Long Island, NY-NJ-PA Metropolitan Statistical Area | 8.4 |
Chicago-Joliet-Naperville, IL-IN-WI Metropolitan Statistical Area | 8.3 |
San Diego-Carlsbad-San Marcos, CA Metropolitan Statistical Area | 8.3 |
Hartford-West Hartford-East Hartford, CT Metropolitan NECTA | 8.2 |
Tampa-St. Petersburg-Clearwater, FL Metropolitan Statistical Area | 8.1 |
Atlanta-Sandy Springs-Marietta, GA Metropolitan Statistical Area | 8.0 |
Philadelphia-Camden-Wilmington, PA-NJ-DE-MD Metropolitan Statistical Area | 8.0 |
Buffalo-Niagara Falls, NY Metropolitan Statistical Area | 7.9 |
Orlando-Kissimmee-Sanford, FL Metropolitan Statistical Area | 7.8 |
San Jose-Sunnyvale-Santa Clara, CA Metropolitan Statistical Area | 7.8 |
Memphis, TN-MS-AR Metropolitan Statistical Area | 7.7 |
Miami-Fort Lauderdale-Pompano Beach, FL Metropolitan Statistical Area | 7.7 |
Indianapolis-Carmel, IN Metropolitan Statistical Area | 7.6 |
Jacksonville, FL Metropolitan Statistical Area | 7.6 |
San Francisco-Oakland-Fremont, CA Metropolitan Statistical Area | 7.5 |
Denver-Aurora-Broomfield, CO Metropolitan Statistical Area | 7.4 |
Louisville-Jefferson County, KY-IN Metropolitan Statistical Area | 7.4 |
Portland-Vancouver-Hillsboro, OR-WA Metropolitan Statistical Area | 7.4 |
Rochester, NY Metropolitan Statistical Area | 7.4 |
St. Louis, MO-IL Metropolitan Statistical Area | 6.9 |
Baltimore-Towson, MD Metropolitan Statistical Area | 6.8 |
Milwaukee-Waukesha-West Allis, WI Metropolitan Statistical Area | 6.8 |
Seattle-Tacoma-Bellevue, WA Metropolitan Statistical Area | 6.8 |
Cleveland-Elyria-Mentor, OH Metropolitan Statistical Area | 6.7 |
Phoenix-Mesa-Glendale, AZ Metropolitan Statistical Area | 6.5 |
Pittsburgh, PA Metropolitan Statistical Area | 6.5 |
Cincinnati-Middletown, OH-KY-IN Metropolitan Statistical Area | 6.3 |
Kansas City, MO-KS Metropolitan Statistical Area | 6.1 |
Birmingham-Hoover, AL Metropolitan Statistical Area | 6.0 |
Virginia Beach-Norfolk-Newport News, VA-NC Metropolitan Statistical Area | 6.0 |
Richmond, VA Metropolitan Statistical Area | 5.9 |
Houston-Sugar Land-Baytown, TX Metropolitan Statistical Area | 5.8 |
Dallas-Fort Worth-Arlington, TX Metropolitan Statistical Area | 5.7 |
Boston-Cambridge-Quincy, MA-NH Metropolitan NECTA | 5.6 |
San Antonio-New Braunfels, TX Metropolitan Statistical Area | 5.6 |
Columbus, OH Metropolitan Statistical Area | 5.5 |
Nashville-Davidson--Murfreesboro--Franklin, TN Metropolitan Statistical Area | 5.5 |
Minneapolis-St. Paul-Bloomington, MN-WI Metropolitan Statistical Area | 5.0 |
Washington-Arlington-Alexandria, DC-VA-MD-WV Metropolitan Statistical Area | 5.0 |
Austin-Round Rock-San Marcos, TX Metropolitan Statistical Area | 4.9 |
New Orleans-Metairie-Kenner, LA Metropolitan Statistical Area | 4.7 |
Oklahoma City, OK Metropolitan Statistical Area | 4.5 |
Footnotes: | |
From November 2011 to November 2012, Las Vegas-Paradise, Nevada, experienced the largest unemployment rate decline (−2.6 percentage points). The next largest decreases were reported in Tampa-St. Petersburg-Clearwater, Florida (−2.2 percentage points), and Orlando-Kissimmee-Sanford, Florida (−2.1 points). Buffalo-Niagara Falls, New York, and Hartford-West Hartford-East Hartford, Connecticut, recorded the largest unemployment rate increases (+0.4 percentage point each).
These metropolitan area data are from the Current Employment Statistics (State and Area) and Local Area Unemployment Statistics programs and are not seasonally adjusted. Data for the most recent month are preliminary and subject to revision. To learn more, see "Metropolitan Area Employment and Unemployment — November 2012" (HTML) (PDF), news release USDL-13-0014.
Bureau of Labor Statistics, U.S. Department of Labor, The Economics Daily, Employment and unemployment in large metropolitan areas, November 2012 at https://www.bls.gov/opub/ted/2013/ted_20130109.htm (visited July 12, 2025).

