
An official website of the United States government
An official website of the United States government
The .gov means it's official.
Federal government websites often end in .gov or .mil. Before sharing sensitive information,
make sure you're on a federal government site.
The site is secure.
The
https:// ensures that you are connecting to the official website and that any
information you provide is encrypted and transmitted securely.
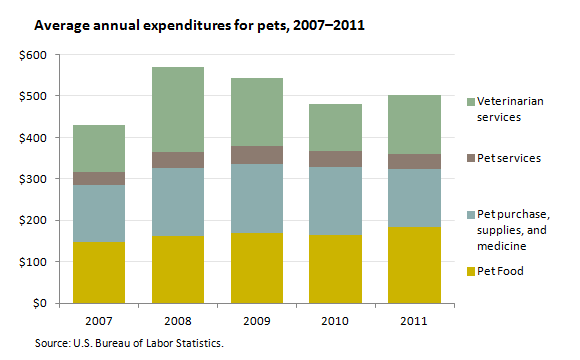
Nearly three-quarters of U.S. households own pets. There are about 218 million pets in the United States, not counting several million pet fish. Americans spent approximately $61.4 billion in total on their pets in 2011. On average, each U.S. household spent just over $500 on pets. This amounts to about 1 percent of total spending per year for the average household. Expenditures on pets include pet food, pet purchases, supplies and medicine, pet services, and veterinarian services.
| Item | 2007 | 2008 | 2009 | 2010 | 2011 |
|---|---|---|---|---|---|
Total average household spending | $49,638 | $50,486 | $49,067 | $48,109 | $49,705 |
Total average household spending on pets | 430.80 | 570.88 | 542.85 | 480.09 | 502.05 |
Pet Food | 146.88 | 163.13 | 168.92 | 165.20 | 182.75 |
Pet purchase, supplies, and medicine | 139.06 | 164.01 | 165.83 | 162.51 | 140.90 |
Pet services | 31.68 | 36.77 | 43.36 | 38.87 | 35.72 |
Veterinarian services | 113.18 | 206.96 | 164.74 | 113.52 | 142.60 |
Despite the difficult economic conditions brought on by the recession, families continued to spend consistently on their pets between 2007 and 2011. Although the amount that households spent on pets varied from year to year, the share of household spending on pets stayed relatively constant, within a narrow range of 0.9 to 1.1 percent of total spending. Household spending on pet food increased very slowly or remained relatively unchanged between 2007 and 2011. In 2007, annual pet food spending was $147, increasing to $163 in 2008, and then leveling off at $169 in 2009 and $165 in 2010. The amount climbed again by less than $20 to $183 in 2011.
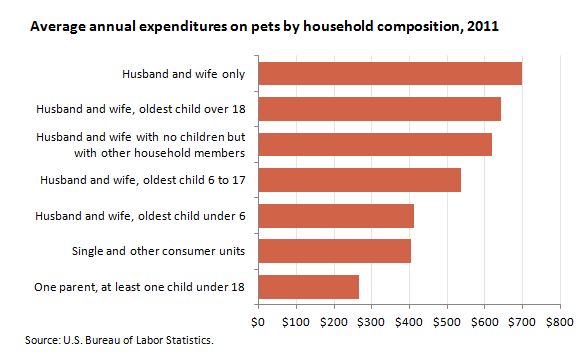
Comparing expenditures of households by household type and by age of children, married couples without children living at home spent the most on their pets in 2011, spending $698 on average. Single-parent households with at least one child under age 18 spent the least on pets, with an average of $267.
| Household composition | Average annual expenditures |
|---|---|
Husband and wife only | $698 |
Husband and wife, oldest child over 18 | 644 |
Husband and wife with no children but with other household members | 619 |
Husband and wife, oldest child 6 to 17 | 536 |
Husband and wife, oldest child under 6 | 412 |
Single and other consumer units | 405 |
One parent, at least one child under 18 | 267 |
Other interesting differences occur for married couples who have children. Parents with younger children spent much less on pets than did parents with older children. Married couples with children spent the least on pets when their oldest child was under 6; this expenditure rose by more than $100 if the oldest child was between the ages of 6 and 17, and increased another $100 when the oldest child at home was over age 18.
These data are from the Consumer Expenditure Survey. To learn more, see “Spending on pets: ‘Tails’ from the Consumer Expenditure Survey” (HTML) (PDF), by Steve Henderson, Beyond the Numbers, May 2013.
Bureau of Labor Statistics, U.S. Department of Labor, The Economics Daily, Household spending on pets at https://www.bls.gov/opub/ted/2013/ted_20130529.htm (visited July 12, 2025).

