
An official website of the United States government
An official website of the United States government
The .gov means it's official.
Federal government websites often end in .gov or .mil. Before sharing sensitive information,
make sure you're on a federal government site.
The site is secure.
The
https:// ensures that you are connecting to the official website and that any
information you provide is encrypted and transmitted securely.
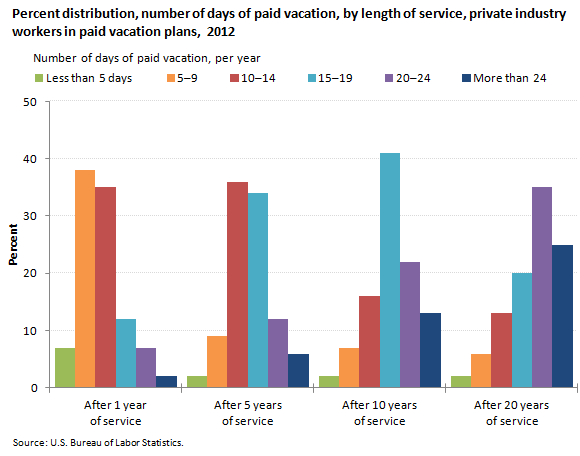
During 2012, 38 percent of private industry workers who had 1 year of service with their employer (and had access to a paid vacation plan) received between 5 and 9 paid vacation days per year, and 35 percent received between 10 and 14 paid vacation days. On average, workers with 1 year of service received 10 days of paid vacation in 2012.
| Number of vacation days per year | Length of service | |||
|---|---|---|---|---|
| After 1 year of service | After 5 years of service | After 10 years of service | After 20 years of service | |
Access to less than 5 paid vacation days per year | 7 | 2 | 2 | 2 |
Access to 5 to 9 paid vacation days | 38 | 9 | 7 | 6 |
Access to 10 to 14 paid vacation days | 35 | 36 | 16 | 13 |
Access to 15 to 19 paid vacation days | 12 | 34 | 41 | 20 |
Access to 20 to 24 paid vacation days | 7 | 12 | 22 | 35 |
Access to more than 24 paid vacation days | 2 | 6 | 13 | 25 |
| Vacation days | Length of service | |||
|---|---|---|---|---|
| After 1 year of service | After 5 years of service | After 10 years of service | After 20 years of service | |
Mean number of vacation days | 10 | 14 | 17 | 19 |
Among private industry workers with 5 years of service, more were in the 10–14 days of paid vacation category than any other category: 36 percent of these workers received 10 to 14 paid vacation days in 2012, while 34 percent received between 15 and 19 days. On average, workers with 5 years of service received 14 days of paid vacation.
Among workers with 10 years of service, the 15–19 days of paid vacation category was the most common, accounting for 41 percent of workers on the job with the same employer for a decade. These workers had, on average, 17 days of paid vacation in 2012.
Workers with 20 years of service were more likely to be in the 20–24 days of paid vacation category during 2012; 35 percent of these workers were in this category. On average, workers with two decades of service received 19 paid vacation days in 2012.
These data are from the National Compensation Survey - Benefits program. To learn more, see the "Paid vacations" tables on the Paid Time-Off Benefits, March 2012 page (part of National Compensation Survey: Employee Benefits in the United States, March 2012). The data can also be found in the EBS databases on the program homepage. Note that these numbers are based on employees who have access to paid vacation days; employees who do not receive paid vacation days are not included in the calculations.
Bureau of Labor Statistics, U.S. Department of Labor, The Economics Daily, In 2012, private industry workers averaged 10 days paid vacation after 1 year of service at https://www.bls.gov/opub/ted/2013/ted_20130730.htm (visited July 12, 2025).

