An official website of the United States government
An official website of the United States government
The .gov means it's official.
Federal government websites often end in .gov or .mil. Before sharing sensitive information,
make sure you're on a federal government site.
The site is secure.
The
https:// ensures that you are connecting to the official website and that any
information you provide is encrypted and transmitted securely.
14-259-PHI
Friday, February 14, 2014
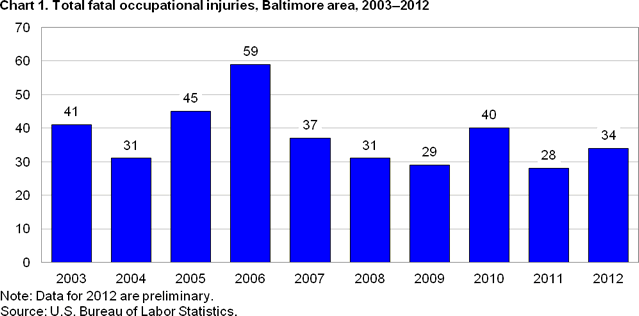
Fatal work injuries totaled 34 in 2012 for the Baltimore-Towson, Md. Metropolitan Statistical Area, the U.S. Bureau of Labor Statistics reported today. Sheila Watkins, the Bureau’s regional commissioner, noted that while the 2012 count was preliminary, the number of work-related fatalities in the Baltimore area increased by six over the year. Fatal occupational injuries in the area have ranged from a high of 59 in 2006 to a low of 28 in 2011. (See chart 1.)
Nationwide, a preliminary total of 4,383 fatal work injuries were recorded in 2012, down from a revised count of 4,693 fatal work injuries in 2011, according to results from the Census of Fatal Occupational Injuries (CFOI) program. Revised 2012 CFOI data will be released in the late Spring of 2014.
Of the 34 fatal work injuries reported in the Baltimore area in 2012, violence and other injuries by persons or animals and transportation incidents each accounted for 9 worker deaths; together, these 2 major categories represented 53 percent of the area’s workplace fatalities. Over the year, workplace fatalities resulting from violence and other injuries by persons or animals increased from 6 in 2011, while transportation incidents declined from 11. Falls, slips, and trips and contact with objects and equipment each accounted for six worker fatalities in 2012, both up from four workplace deaths recorded in 2011. Exposure to harmful substances or environments accounted for four workplace fatalities in 2012. (See table 1. Note that transportation counts presented are expected to rise when updated 2012 data are released in Spring 2014 because key source documentation detailing specific transportation-related incidents has not yet been received.)
Within violence and other injuries by persons or animals, intentional injury by other person (homicide) was the most frequent type of workplace fatality in the Baltimore area with five deaths. Roadway incidents involving a motorized land vehicle was the most frequent event within transportation incidents, accounting for five worker deaths. Falls to a lower level accounted for all of the fatalities in the falls, slips, and trips category, and in contact with objects and equipment, all of the fatalities were a result of being struck by an object or equipment.
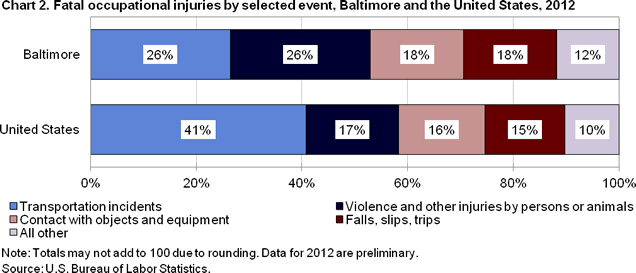
In the United States, transportation incidents was also the most frequent fatal workplace event in 2012, accounting for 41 percent of fatal work injuries. The Baltimore area’s share of on-the-job fatalities due to this event was substantially lower at 26 percent. (See chart 2.) Violence and other injuries by persons or animals was the second-most frequent event nationally with 17 percent of work-related fatalities; Baltimore’s share was higher at 26 percent. Contact with objects and equipment was the third-most frequent event in the nation, representing 16 percent of worker fatalities; in Baltimore, this event accounted for 18 percent of total fatalities.
Additional key characteristics in the Baltimore area:Information in this release will be made available to sensory impaired individuals upon request. Voice phone: (202) 691-5200. Federal Relay Service: (800) 877-8339.
Background of the program. The Census of Fatal Occupational Injuries (CFOI), part of the BLS Occupational Safety and Health Statistics (OSHS) program, compiles a count of all fatal work injuries occurring in the U.S. during the calendar year. The CFOI program uses diverse state, federal, and independent data sources to identify, verify, and describe fatal work injuries. This assures counts are as complete and accurate as possible.
For technical information and definitions for the CFOI program, please go to the BLS Handbook of Methods on the BLS web site at www.bls.gov/opub/hom/pdf/homch9.pdf.
Federal/State agency coverage. The Census of Fatal Occupational Injuries includes data for all fatal work injuries, whether the decedent was working in a job covered by the Occupational Safety and Health Administration (OSHA) or other federal or state agencies or was outside the scope of regulatory coverage. Thus, any comparison between the BLS fatality census counts and those released by other agencies should take into account the different coverage requirements and definitions being used by each agency.
Acknowledgments. BLS thanks the Maryland Department of Labor, Licensing and Regulation for their efforts in collecting accurate, comprehensive, and useful data on fatal work injuries. BLS also appreciates the efforts of all federal, state, local, and private sector entities that submitted source documents used to identify fatal work injuries. Among these agencies are the Occupational Safety and Health Administration; the National Transportation Safety Board; the U.S. Coast Guard; the Mine Safety and Health Administration; the Office of Workers’ Compensation Programs (Federal Employees' Compensation and Longshore and Harbor Workers' Compensation divisions); the Federal Railroad Administration; the National Highway Traffic Safety Administration; state vital statistics registrars, coroners, and medical examiners; state departments of health, labor and industries, and workers' compensation agencies; state and local police departments; and state farm bureaus.
Area definitions. The substate area data published in this release reflect the standards and definitions established by the U.S. Office of Management and Budget, dated December 2009. A detailed list of the geographic definitions is available at https://www.bls.gov/lau/lausmsa.htm.
The Baltimore-Towson, Md. Metropolitan Statistical Area (MSA) is composed of Anne Arundel, Baltimore, Carroll, Harford, Howard, and Queen Anne’s Counties and Baltimore City in Maryland.
| Event or exposure(1) | 2011(2) | 2012(p) | |
|---|---|---|---|
| Number | Number | Percent | |
|
Total |
28 | 34 | 100 |
|
Violence and other injuries by persons or animals |
6 | 9 | 26 |
|
Intentional injury by person |
4 | 8 | 24 |
|
Intentional injury by other person |
2 | 5 | 15 |
|
Shooting by other person--intentional |
1 | 4 | 12 |
|
Stabbing, cutting, slashing, piercing |
- | 1 | 3 |
|
Self inflicted injury--intentional |
- | 3 | 9 |
|
Transportation incidents |
11 | 9 | 26 |
|
Roadway incident involving motorized land vehicle |
6 | 5 | 15 |
|
Roadway collision with other vehicle |
2 | 3 | 9 |
|
Roadway collision--moving in opposite directions, oncoming |
- | 1 | 3 |
|
Roadway collision--moving perpendicularly |
- | 1 | 3 |
|
Falls, slips, trips |
4 | 6 | 18 |
|
Falls to lower level |
- | 6 | 18 |
|
Other fall to lower level |
- | 5 | 15 |
|
Other fall to lower level 16 to 20 feet |
- | 2 | 6 |
|
Exposure to harmful substances or environments |
- | 4 | 12 |
|
Exposure to electricity |
- | 2 | 6 |
|
Indirect exposure to electricity |
- | 2 | 6 |
|
Indirect exposure to electricity, greater than 220 volts |
- | 2 | 6 |
|
Contact with objects and equipment |
4 | 6 | 18 |
|
Struck by object or equipment |
3 | 6 | 18 |
|
Struck by powered vehicle--nontransport |
1 | 2 | 6 |
|
Struck by falling part of powered vehicle still attached |
- | 1 | 3 |
|
Struck by rolling object or equipment--other than powered vehicle |
- | 1 | 3 |
|
Struck by rolling object or equipment being pushed by injured worker |
- | 1 | 3 |
|
Struck by falling object or equipment--other than powered vehicle |
2 | 3 | 9 |
|
Footnotes: |
|||
|
NOTE: Totals for major categories may include subcategories not shown separately. Percentages may not add to totals because of rounding. Dashes indicate no data reported or data that do not meet publication criteria. CFOI fatality counts exclude illness-related deaths unless precipitated by an injury event. |
|||
| Industry(1) | 2011(2) | 2012(p) | |
|---|---|---|---|
| Number | Number | Percent | |
|
Total |
28 | 34 | 100 |
|
Private industry |
24 | 29 | 85 |
|
Goods-producing |
7 | 8 | 24 |
|
Construction |
3 | 7 | 21 |
|
Construction |
3 | 7 | 21 |
|
Construction of buildings |
- | 3 | 9 |
|
Residential building construction |
- | 3 | 9 |
|
Residential building construction |
- | 3 | 9 |
|
Residential remodelers |
- | 3 | 9 |
|
Specialty trade contractors |
3 | 4 | 12 |
|
Foundation, structure, and building exterior contractors |
- | 1 | 3 |
|
Siding contractors |
- | 1 | 3 |
|
Building equipment contractors |
1 | 1 | 3 |
|
Plumbing, heating, and air-conditioning contractors |
- | 1 | 3 |
|
Manufacturing |
- | 1 | 3 |
|
Manufacturing |
- | 1 | 3 |
|
Food manufacturing |
- | 1 | 3 |
|
Other food manufacturing |
- | 1 | 3 |
|
Seasoning and dressing manufacturing |
- | 1 | 3 |
|
Spice and extract manufacturing |
- | 1 | 3 |
|
Service-providing |
17 | 21 | 62 |
|
Trade, transportation, and utilities |
8 | 12 | 35 |
|
Wholesale trade |
3 | 1 | 3 |
|
Merchant wholesalers, durable goods |
- | 1 | 3 |
|
Electrical goods merchant wholesalers |
- | 1 | 3 |
|
Electrical apparatus and equipment, wiring supplies, and related equipment merchant wholesalers |
- | 1 | 3 |
|
Retail trade |
- | 4 | 12 |
|
Motor vehicle and parts dealers |
- | - | - |
|
Other motor vehicle dealers |
- | 1 | 3 |
|
Motorcycle, boat, and other motor vehicle dealers |
- | 1 | 3 |
|
General merchandise stores |
- | 1 | 3 |
|
Department stores |
- | 1 | 3 |
|
Department stores |
- | 1 | 3 |
|
Discount department stores |
- | 1 | 3 |
|
Transportation and warehousing |
5 | 7 | 21 |
|
Truck transportation |
- | 5 | 15 |
|
General freight trucking |
- | 2 | 6 |
|
General freight trucking, local |
- | 1 | 3 |
|
General freight trucking, long-distance |
- | 1 | 3 |
|
General freight trucking, long-distance, truckload |
- | 1 | 3 |
|
Specialized freight trucking |
- | 3 | 9 |
|
Transit and ground passenger transportation |
- | 1 | 3 |
|
Taxi and limousine service |
- | 1 | 3 |
|
Taxi service |
- | 1 | 3 |
|
Financial activities |
- | 1 | 3 |
|
Real estate and rental and leasing |
- | 1 | 3 |
|
Real estate |
- | 1 | 3 |
|
Lessors of real estate |
- | 1 | 3 |
|
Lessors of residential buildings and dwellings |
- | 1 | 3 |
|
Professional and business services |
5 | 4 | 12 |
|
Administrative and waste services |
4 | 4 | 12 |
|
Administrative and support services |
- | 4 | 12 |
|
Services to buildings and dwellings |
- | 4 | 12 |
|
Landscaping services |
- | 3 | 9 |
|
Leisure and hospitality |
- | 2 | 6 |
|
Accommodation and food services |
- | 2 | 6 |
|
Food services and drinking places |
- | 2 | 6 |
|
Limited-service eating places |
- | 1 | 3 |
|
Limited-service eating places |
- | 1 | 3 |
|
Limited-service restaurants |
- | 1 | 3 |
|
Drinking places (alcoholic beverages) |
- | 1 | 3 |
|
Drinking places (alcoholic beverages) |
- | 1 | 3 |
|
Other services, except public administration |
- | 2 | 6 |
|
Other services, except public administration |
- | 2 | 6 |
|
Religious, grantmaking, civic, professional, and similar organizations |
- | 2 | 6 |
|
Religious organizations |
- | 2 | 6 |
|
Religious organizations |
- | 2 | 6 |
|
Government(3) |
4 | 5 | 15 |
|
Local government |
2 | 2 | 6 |
|
Service-providing |
2 | 2 | 6 |
|
Education and health services |
- | 1 | 3 |
|
Educational services |
- | 1 | 3 |
|
Educational services |
- | 1 | 3 |
|
Elementary and secondary schools |
- | 1 | 3 |
|
Elementary and secondary schools |
- | 1 | 3 |
|
Public administration |
2 | 1 | 3 |
|
Public administration |
2 | 1 | 3 |
|
Justice, public order, and safety activities |
2 | 1 | 3 |
|
Justice, public order, and safety activities |
2 | 1 | 3 |
|
Police protection |
1 | 1 | 3 |
|
Footnotes: |
|||
|
NOTE: Totals for major categories may include subcategories not shown separately. Percentages may not add to totals because of rounding. Dashes indicate no data reported or data that do not meet publication criteria. CFOI fatality counts exclude illness-related deaths unless precipitated by an injury event. |
|||
| Occupation | 2011(2) | 2012(p) | |
|---|---|---|---|
| Number | Number | Percent | |
|
Total |
28 | 34 | 100 |
|
Management occupations |
- | - | - |
|
Other management occupations |
- | - | - |
|
Food service managers |
- | 1 | 3 |
|
Food service managers |
- | 1 | 3 |
|
Community and social services occupations |
- | 1 | 3 |
|
Religious workers |
- | 1 | 3 |
|
Clergy |
- | 1 | 3 |
|
Clergy |
- | 1 | 3 |
|
Protective service occupations |
4 | 2 | 6 |
|
Law enforcement workers |
2 | 1 | 3 |
|
Police officers |
2 | 1 | 3 |
|
Police and sheriff's patrol officers |
2 | 1 | 3 |
|
Other protective service workers |
- | 1 | 3 |
|
Security guards and gaming surveillance officers |
- | 1 | 3 |
|
Security guards |
- | 1 | 3 |
|
Building and grounds cleaning and maintenance occupations |
- | 4 | 12 |
|
Supervisors of building and grounds cleaning and maintenance workers |
- | 1 | 3 |
|
First-line supervisors of building and grounds cleaning and maintenance workers |
- | 1 | 3 |
|
First-line supervisors of housekeeping and janitorial workers |
- | 1 | 3 |
|
Grounds maintenance workers |
- | 3 | 9 |
|
Grounds maintenance workers |
- | 3 | 9 |
|
Landscaping and groundskeeping workers |
- | 1 | 3 |
|
Sales and related occupations |
- | 1 | 3 |
|
Sales representatives, wholesale and manufacturing |
- | 1 | 3 |
|
Sales representatives, wholesale and manufacturing |
- | 1 | 3 |
|
Sales representatives, wholesale and manufacturing, except technical and scientific products |
- | 1 | 3 |
|
Office and administrative support occupations |
- | 4 | 12 |
|
Material recording, scheduling, dispatching, and distributing workers |
- | 3 | 9 |
|
Stock clerks and order fillers |
- | 1 | 3 |
|
Stock clerks and order fillers |
- | 1 | 3 |
|
Secretaries and administrative assistants |
- | 1 | 3 |
|
Secretaries and administrative assistants |
- | 1 | 3 |
|
Secretaries and administrative assistants, except legal, medical, and executive |
- | 1 | 3 |
|
Construction and extraction occupations |
4 | 7 | 21 |
|
Construction trades workers |
- | 5 | 15 |
|
Electricians |
- | 1 | 3 |
|
Electricians |
- | 1 | 3 |
|
Roofers |
- | 1 | 3 |
|
Roofers |
- | 1 | 3 |
|
Installation, maintenance, and repair occupations |
- | 4 | 12 |
|
Other installation, maintenance, and repair occupations |
1 | 3 | 9 |
|
Heating, air conditioning, and refrigeration mechanics and installers |
- | 1 | 3 |
|
Heating, air conditioning, and refrigeration mechanics and installers |
- | 1 | 3 |
|
Transportation and material moving occupations |
7 | 8 | 24 |
|
Motor vehicle operators |
5 | 5 | 15 |
|
Driver/sales workers and truck drivers |
4 | 4 | 12 |
|
Heavy and tractor-trailer truck drivers |
4 | 4 | 12 |
|
Footnotes: |
|||
|
NOTE: Totals for major categories may include subcategories not shown separately. Percentages may not add to totals because of rounding. Dashes indicate no data reported or data that do not meet publication criteria. CFOI fatality counts exclude illness-related deaths unless precipitated by an injury event. |
|||
| Worker characteristics | 2011(1) | 2012(p) | |
|---|---|---|---|
| Number | Number | Percent | |
|
Total |
28 | 34 | 100 |
| Employee status | |||
|
Wage and salary workers(2) |
23 | 27 | 79 |
|
Self-employed(3) |
5 | 7 | 21 |
| Gender | |||
|
Men |
27 | 30 | 88 |
|
Women |
- | 4 | 12 |
| Age(4) | |||
|
25 to 34 years |
5 | 6 | 18 |
|
35 to 44 years |
7 | 6 | 18 |
|
45 to 54 years |
7 | 7 | 21 |
|
55 to 64 years |
6 | 13 | 38 |
| Race or ethnic origin(5) | |||
|
White (non-Hispanic) |
14 | 18 | 53 |
|
Black or African-American (non-Hispanic) |
8 | 10 | 29 |
|
Hispanic or Latino |
4 | 5 | 15 |
|
Footnotes: |
|||
|
NOTE: Totals for major categories may include subcategories not shown separately. Percentages may not add to totals because of rounding. Dashes indicate no data reported or data do not meet publication criteria. CFOI fatality counts exclude illness-related deaths unless precipitated by an injury event. |
|||
Last Modified Date: Friday, February 14, 2014