
An official website of the United States government
An official website of the United States government
The .gov means it's official.
Federal government websites often end in .gov or .mil. Before sharing sensitive information,
make sure you're on a federal government site.
The site is secure.
The
https:// ensures that you are connecting to the official website and that any
information you provide is encrypted and transmitted securely.
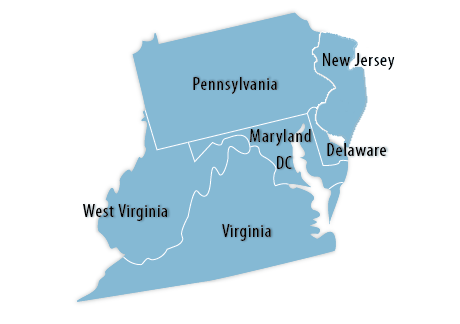
Click a state from the map or pick a state from the list:
Delaware | District of Columbia | Maryland | New Jersey | Pennsylvania | Virginia | West Virginia
 Economic Summaries:
Economic Summaries are specialized products that combine data graphically from subjects such as unemployment, inflation, and wages into a single document for selected metropolitan areas. To view a specific area in this region, use the dropdown list below or click here.
Private industry employer costs for employee compensation among the four regions of the country ranged from $41.59 per hour in the South to $54.61 in the Northeast in March 2026.
Employment rose in 8 of the 15 largest counties in New Jersey from December 2024 to December 2025, the U.S. Bureau of Labor Statistics reported today.
Employment declined 0.5 percent in West Virginia’s only large county, Kanawha, from December 2024 to December 2025, the U.S. Bureau of Labor Statistics reported today.
Employment declined in 7 of the 8 largest counties in Maryland from December 2024 to December 2025, the U.S. Bureau of Labor Statistics reported today.
The Consumer Price Index for All Urban Consumers (CPI-U) for New York-Newark-Jersey City increased 0.4 percent in May.