An official website of the United States government
An official website of the United States government
The .gov means it's official.
Federal government websites often end in .gov or .mil. Before sharing sensitive information,
make sure you're on a federal government site.
The site is secure.
The
https:// ensures that you are connecting to the official website and that any
information you provide is encrypted and transmitted securely.
26-441-PHI
Thursday, March 05, 2026
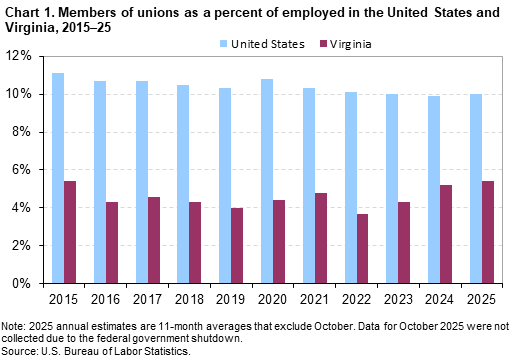
In 2025, union members accounted for an estimated 5.4 percent of wage and salary workers in Virginia, the U.S. Bureau of Labor Statistics reported today. (See chart 1 and table 1.) Regional Commissioner Alexandra Hall Bovee noted that the estimated number of workers belonging to unions was 204,000. Nationwide, union members accounted for an estimated 10.0 percent of employed wage and salary workers.
Across states, the estimated rates of union membership varied widely, ranging from below 5 percent to nearly 25 percent. (See map 1.) State union membership data for 2025 are based on relatively few observations and only allow for broad characterizations. (See box note below for additional information.)
In addition to union members, another estimated 40,000 wage and salary workers in Virginia were represented by a union on their main job or covered by an employee association or contract while not union members themselves. Workers represented by unions accounted for an estimated 6.4 percent of employed wage and salary workers in Virginia and 11.2 percent nationwide.
The Current Population Survey (CPS) for October 2025 was not collected due to the federal government shutdown. As a result, annual estimates for 2025 household survey data were produced using 11-month averages that exclude October. Consequently, 2025 annual estimates are not strictly comparable with annual averages for other years.
Because union membership and earnings data are collected from only one quarter of the CPS sample, they are already based on a relatively small number of observations and are even more affected by the lack of October data. In particular, state union membership estimates for 2025 should be interpreted with caution.
More information about the impact of the federal government shutdown on CPS data is available online.
The estimates in this release are obtained from the Current Population Survey (CPS), which provides basic information on the labor force, employment, and unemployment. The survey is conducted monthly for the Bureau of Labor Statistics by the U.S. Census Bureau from a scientifically selected national sample of about 60,000 eligible households. The union membership data are tabulated from one-quarter of the CPS monthly sample and are limited to wage and salary workers. All self-employed workers are excluded.
This release preserves the long-time practice of highlighting the state union membership rates and levels regardless of their statistical significance. More information is available in the Union Members Technical Note.
If you are deaf, hard of hearing, or have a speech disability, please dial 7-1-1 to access telecommunications relay services.
| State | 2024 | 2025 | ||||||||
|---|---|---|---|---|---|---|---|---|---|---|
| Total employed |
Members of unions(1) | Represented by unions(2) |
Total employed |
Members of unions(1) | Represented by unions(2) |
|||||
| Total | Percent of employed |
Total | Percent of employed |
Total | Percent of employed |
Total | Percent of employed |
|||
|
Alabama |
2,110 | 140 | 6.6 | 165 | 7.8 | 2,090 | 131 | 6.3 | 150 | 7.2 |
|
Alaska |
300 | 53 | 17.7 | 58 | 19.5 | 315 | 57 | 18.1 | 65 | 20.7 |
|
Arizona |
3,183 | 118 | 3.7 | 144 | 4.5 | 3,256 | 132 | 4.1 | 148 | 4.5 |
|
Arkansas |
1,265 | 45 | 3.5 | 56 | 4.4 | 1,250 | 36 | 2.8 | 44 | 3.5 |
|
California |
16,399 | 2,381 | 14.5 | 2,678 | 16.3 | 16,651 | 2,489 | 14.9 | 2,784 | 16.7 |
|
Colorado |
2,671 | 206 | 7.7 | 214 | 8.0 | 2,706 | 161 | 5.9 | 180 | 6.7 |
|
Connecticut |
1,634 | 269 | 16.5 | 291 | 17.8 | 1,652 | 266 | 16.1 | 284 | 17.2 |
|
Delaware |
435 | 37 | 8.5 | 39 | 8.9 | 451 | 47 | 10.4 | 52 | 11.5 |
|
District of Columbia |
362 | 38 | 10.6 | 42 | 11.7 | 364 | 34 | 9.2 | 39 | 10.7 |
|
Florida |
9,086 | 462 | 5.1 | 569 | 6.3 | 9,328 | 503 | 5.4 | 581 | 6.2 |
|
Georgia |
4,619 | 174 | 3.8 | 203 | 4.4 | 4,601 | 236 | 5.1 | 280 | 6.1 |
|
Hawaii |
556 | 147 | 26.5 | 153 | 27.5 | 586 | 145 | 24.8 | 152 | 26.0 |
|
Idaho |
850 | 43 | 5.0 | 50 | 5.9 | 875 | 36 | 4.1 | 47 | 5.3 |
|
Illinois |
5,615 | 734 | 13.1 | 798 | 14.2 | 5,778 | 758 | 13.1 | 812 | 14.0 |
|
Indiana |
2,999 | 271 | 9.0 | 313 | 10.4 | 3,143 | 260 | 8.3 | 301 | 9.6 |
|
Iowa |
1,437 | 93 | 6.4 | 119 | 8.3 | 1,478 | 101 | 6.8 | 122 | 8.2 |
|
Kansas |
1,309 | 83 | 6.3 | 105 | 8.0 | 1,358 | 84 | 6.2 | 122 | 9.0 |
|
Kentucky |
1,761 | 156 | 8.8 | 197 | 11.2 | 1,769 | 157 | 8.9 | 187 | 10.5 |
|
Louisiana |
1,741 | 69 | 3.9 | 86 | 5.0 | 1,795 | 79 | 4.4 | 99 | 5.5 |
|
Maine |
585 | 77 | 13.1 | 89 | 15.3 | 601 | 71 | 11.9 | 85 | 14.1 |
|
Maryland |
2,851 | 325 | 11.4 | 382 | 13.4 | 2,711 | 346 | 12.7 | 406 | 15.0 |
|
Massachusetts |
3,397 | 496 | 14.6 | 531 | 15.6 | 3,427 | 498 | 14.5 | 527 | 15.4 |
|
Michigan |
4,346 | 581 | 13.4 | 639 | 14.7 | 4,354 | 566 | 13.0 | 620 | 14.2 |
|
Minnesota |
2,668 | 379 | 14.2 | 394 | 14.8 | 2,731 | 386 | 14.1 | 431 | 15.8 |
|
Mississippi |
1,129 | 59 | 5.2 | 90 | 7.9 | 1,111 | 47 | 4.2 | 81 | 7.3 |
|
Missouri |
2,734 | 234 | 8.6 | 255 | 9.3 | 2,759 | 271 | 9.8 | 309 | 11.2 |
|
Montana |
474 | 56 | 11.9 | 62 | 13.1 | 471 | 53 | 11.2 | 58 | 12.3 |
|
Nebraska |
913 | 62 | 6.8 | 74 | 8.1 | 973 | 64 | 6.6 | 82 | 8.5 |
|
Nevada |
1,367 | 166 | 12.1 | 183 | 13.4 | 1,460 | 189 | 13.0 | 208 | 14.3 |
|
New Hampshire |
678 | 62 | 9.2 | 72 | 10.6 | 676 | 60 | 8.9 | 67 | 9.9 |
|
New Jersey |
4,197 | 682 | 16.2 | 730 | 17.4 | 4,158 | 612 | 14.7 | 670 | 16.1 |
|
New Mexico |
834 | 63 | 7.5 | 73 | 8.8 | 855 | 52 | 6.1 | 68 | 7.9 |
|
New York |
8,278 | 1,706 | 20.6 | 1,814 | 21.9 | 8,624 | 1,834 | 21.3 | 1,943 | 22.5 |
|
North Carolina |
4,555 | 108 | 2.4 | 142 | 3.1 | 4,547 | 113 | 2.5 | 140 | 3.1 |
|
North Dakota |
366 | 18 | 5.0 | 23 | 6.3 | 385 | 23 | 6.0 | 28 | 7.4 |
|
Ohio |
5,147 | 621 | 12.1 | 685 | 13.3 | 5,196 | 605 | 11.6 | 666 | 12.8 |
|
Oklahoma |
1,713 | 91 | 5.3 | 106 | 6.2 | 1,749 | 106 | 6.1 | 127 | 7.3 |
|
Oregon |
1,835 | 292 | 15.9 | 321 | 17.5 | 1,867 | 283 | 15.1 | 316 | 16.9 |
|
Pennsylvania |
5,706 | 666 | 11.7 | 708 | 12.4 | 5,679 | 620 | 10.9 | 665 | 11.7 |
|
Rhode Island |
500 | 73 | 14.5 | 77 | 15.3 | 509 | 82 | 16.1 | 89 | 17.5 |
|
South Carolina |
2,163 | 61 | 2.8 | 89 | 4.1 | 2,324 | 63 | 2.7 | 96 | 4.1 |
|
South Dakota |
431 | 12 | 2.7 | 16 | 3.7 | 415 | 10 | 2.3 | 13 | 3.1 |
|
Tennessee |
2,923 | 136 | 4.7 | 164 | 5.6 | 3,057 | 145 | 4.8 | 176 | 5.7 |
|
Texas |
13,345 | 603 | 4.5 | 716 | 5.4 | 13,731 | 673 | 4.9 | 793 | 5.8 |
|
Utah |
1,558 | 58 | 3.7 | 122 | 7.8 | 1,608 | 61 | 3.8 | 125 | 7.8 |
|
Vermont |
297 | 42 | 14.3 | 47 | 15.8 | 293 | 38 | 13.1 | 43 | 14.8 |
|
Virginia |
3,997 | 207 | 5.2 | 229 | 5.7 | 3,797 | 204 | 5.4 | 244 | 6.4 |
|
Washington |
3,432 | 548 | 16.0 | 627 | 18.3 | 3,512 | 632 | 18.0 | 681 | 19.4 |
|
West Virginia |
699 | 61 | 8.8 | 70 | 10.0 | 703 | 60 | 8.5 | 64 | 9.1 |
|
Wisconsin |
2,819 | 180 | 6.4 | 196 | 6.9 | 2,691 | 173 | 6.4 | 202 | 7.5 |
|
Wyoming |
249 | 14 | 5.6 | 17 | 6.7 | 240 | 14 | 6.0 | 17 | 7.2 |
|
Footnotes |
||||||||||
|
Note: Data refer to the sole or principal job of full- and part-time wage and salary workers. All self-employed workers are excluded, both those with incorporated businesses as well as those with unincorporated businesses. Updated population controls are introduced annually with the release of January data. Annual estimates for 2025 are 11-month averages that exclude October. (Data for October 2025 were not collected due to the federal government shutdown.) As a result, 2025 annual estimates are not strictly comparable with annual averages for other years. |
||||||||||
Last Modified Date: Thursday, March 05, 2026