An official website of the United States government
An official website of the United States government
The .gov means it's official.
Federal government websites often end in .gov or .mil. Before sharing sensitive information,
make sure you're on a federal government site.
The site is secure.
The
https:// ensures that you are connecting to the official website and that any
information you provide is encrypted and transmitted securely.
15-2116-PHI
Thursday, October 29, 2015
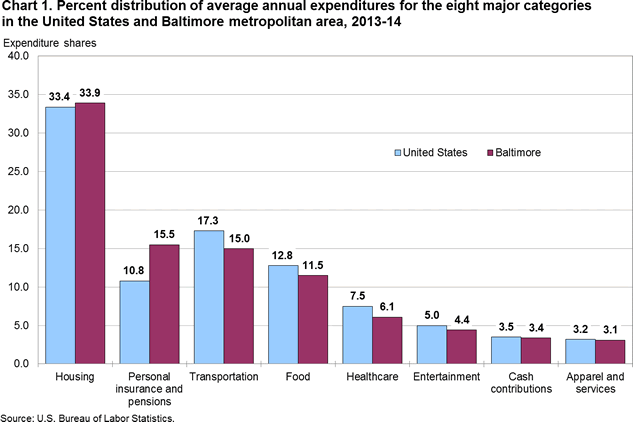
Households in the Baltimore-Towson, Md., metropolitan area spent an average of $63,145 per year in 2013–14, the U.S. Bureau of Labor Statistics reported today. Regional Commissioner Sheila Watkins noted that this figure was significantly higher than the $52,284 average expenditure level for households in the United States. Baltimore-area households allocated their dollars similarly among most of the eight major categories, with only three differing significantly from the U.S. average. For example, the share of expenditures for healthcare, which accounted for 6.1 percent of the average household’s budget in the Baltimore area, was significantly lower than the national average of 7.5 percent. (See chart 1 and table 1.)
Highlights of the Baltimore area’s 2013–14 spending patterns:
Data in this release are from the Consumer Expenditure Survey (CE), which the U.S. Census Bureau conducts for the U.S. Bureau of Labor Statistics. The data in this release were averaged over a 2-year period, 2013 and 2014.
A household in the CE survey is defined as a consumer unit which consists of members related by blood, marriage, adoption, or other legal arrangement; a single person living alone or sharing a household with others but who is financially independent; or two or more persons living together who share responsibility for at least 2 out of 3 major types of expenses – food, housing, and other expenses. The terms household or consumer unit are used interchangeably for convenience.
Differences in spending among metropolitan areas may reflect differences in the cost of living, but they also may reflect other causes. Spending differences may result from different consumer preferences or variations in demographic characteristics, such as household size, age, or income levels. However, expenditure shares, or the percentage of a household’s budget spent on a particular category, can be used to compare spending patterns across areas. Sample sizes for the metropolitan areas are much smaller than for the nation, so the U.S. estimates and year-to-year changes are more reliable than those for the metropolitan areas. Users should also keep in mind that prices for many goods and services have changed since the survey was conducted.
A value that is statistically different from another does not necessarily mean that the difference has economic or practical significance. Statistical significance is concerned with our ability to make confident statements about a universe based on a sample. A large difference between two values may not be statistically significant, while a small difference could be significant; both the sample size and the variation among the values in the sample affect the relative error of the estimates.
For additional technical and related information, see www.bls.gov/opub/hom/pdf/homch16.pdf. Data for the nation, the four geographic regions of the U.S., and 18 metropolitan areas nationwide are available at www.bls.gov/cex/tables.htm. Metropolitan definitions used in the survey are available at www.bls.gov/regions/ce_areadef.pdf . The metropolitan area discussed in this release is Baltimore-Towson, Md., which comprises Anne Arundel, Baltimore, Carroll, Harford, Howard, and Queen Anne’s Counties and Baltimore City in Maryland. Metropolitan area news releases for the Consumer Expenditure Survey are available at www.bls.gov/regions/subjects/consumer-spending.htm.
Information in this release will be made available to sensory impaired individuals upon request. Voice phone: 202-691-5200; Federal Relay Service: 800-877-8339.
| Category | United States | Baltimore |
|---|---|---|
| Consumer unit characteristics: | ||
|
Income before taxes |
$65,339 | $84,605* |
|
Age of reference person |
50.2 | 53.2 |
|
Average number in consumer unit: |
||
|
People |
2.5 | 2.4 |
|
Children under 18 |
0.6 | 0.5 |
|
Adults 65 and older |
0.4 | 0.4 |
|
Earners |
1.3 | 1.4 |
|
Vehicles |
1.9 | 1.9 |
|
Percent homeowner |
63 | 72 |
|
Average annual expenditures |
$52,284 | $63,145 |
|
Percent distribution |
100.0 | 100.0 |
|
Food |
12.8 | 11.5 |
|
Alcoholic beverages |
0.9 | 0.7 |
|
Housing |
33.4 | 33.9 |
|
Apparel and services |
3.2 | 3.1 |
|
Transportation |
17.3 | 15.0 |
|
Health care |
7.5 | 6.1* |
|
Entertainment |
5.0 | 4.4 |
|
Personal care products and services |
1.2 | 1.3 |
|
Reading |
0.2 | 0.2 |
|
Education |
2.3 | 2.9 |
|
Tobacco products and smoking supplies |
0.6 | 0.3* |
|
Miscellaneous |
1.3 | 1.6 |
|
Cash contributions |
3.5 | 3.4 |
|
Personal insurance and pensions |
10.8 | 15.5* |
|
Note: An asterisk (*) represents a statistically significant difference from the U.S. average at the 95-percent confidence level. |
||
| Area | Housing | Transportation | Food |
|---|---|---|---|
|
United States |
33.4 | 17.3 | 12.8 |
|
Atlanta |
33.2 | 16.4 | 12.8 |
|
Baltimore |
33.9 | 15.0 | 11.5 |
|
Boston |
33.3 | 15.1* | 11.7* |
|
Chicago |
35.1* | 15.2* | 12.7 |
|
Cleveland |
31.0* | 18.0 | 13.7 |
|
Dallas |
33.1 | 18.3 | 12.7 |
|
Detroit |
30.2* | 19.2* | 12.4 |
|
Houston |
33.4 | 17.9 | 12.1 |
|
Los Angeles |
38.7* | 15.0* | 13.1 |
|
Miami |
39.4* | 16.8 | 13.0 |
|
Minneapolis |
32.4 | 17.9 | 11.3* |
|
New York |
39.6* | 13.4* | 11.6* |
|
Philadelphia |
35.4* | 16.4 | 12.5 |
|
Phoenix |
34.2 | 19.4 | 13.9 |
|
San Diego |
37.6* | 16.3 | 11.0* |
|
San Francisco |
37.3* | 13.7* | 11.9 |
|
Seattle |
35.0 | 15.3* | 12.3 |
|
Washington |
35.8* | 18.0 | 10.0* |
|
Note: An asterisk (*) represents a statistically significant difference from the U.S. average at the 95-percent confidence level. |
|||
Last Modified Date: Thursday, October 29, 2015