An official website of the United States government
An official website of the United States government
The .gov means it's official.
Federal government websites often end in .gov or .mil. Before sharing sensitive information,
make sure you're on a federal government site.
The site is secure.
The
https:// ensures that you are connecting to the official website and that any
information you provide is encrypted and transmitted securely.
16-49-PHI
Thursday, January 21, 2016
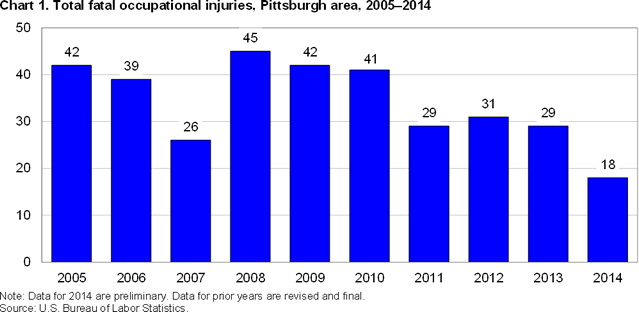
Fatal work injuries totaled 18 in 2014 for the Pittsburgh, Pa. Metropolitan Statistical Area, the U.S. Bureau of Labor Statistics reported today. Sheila Watkins, the Bureau’s regional commissioner, noted that while the 2014 count was preliminary, the number of work-related fatalities in the Pittsburgh area declined by 11 over the year. Since area data first became available in 2003, fatal occupational injuries in the area ranged from a high of 45 in 2008 to a low of 18 in 2014. (See chart 1.)
Nationwide, a preliminary total of 4,679 fatal work injuries were recorded in 2014, up from the revised count of 4,585 fatal work injuries in 2013, according to the results from the Census of Fatal Occupational Injuries (CFOI) program. Final 2014 CFOI data will be released in the late spring of 2016.
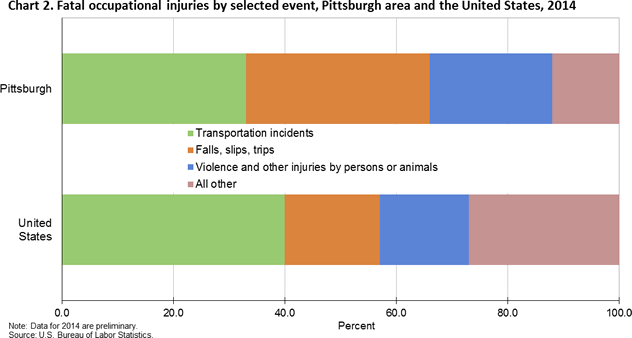
Of the 18 fatal work injuries reported in the Pittsburgh area in 2014, transportation incidents and falls, slips, or trips each accounted for 6 fatal work injuries. Over the year, workplace fatalities resulting from transportation incidents decreased from seven to six, while the number of fatalities from falls, slips, or trips was unchanged from 2013. (See table 1.) Violence and other injuries by persons or animals accounted for four fatal work injuries in 2014, a decrease from the seven fatal injuries reported in 2013.
Within transportation incidents, roadway incidents involving motorized land vehicles was the most frequent type of workplace fatality in the Pittsburgh area with four deaths. Falls to a lower level accounted for 4 of the 6 fatalities in the falls, slips, or trips category. Homicides was the most frequent event within violence and other injuries by person or animals, accounting for 2 of the 4 worker deaths. (Note that roadway incident counts presented are expected to rise when updated 2014 data are released in the late spring of 2016 because key source documentation detailing specific transportation-related incidents has not yet been received.)
In the United States, transportation incidents was the most frequent fatal workplace event in 2014, accounting for 40 percent of fatal work injuries; in Pittsburgh, the area’s share of on-the-job fatalities due to this event was 33 percent. (See chart 2.) Falls, slips, or trips was the second-most frequent event nationally with 17 percent of work-related fatalities; the Pittsburgh area’s share was 33 percent. Violence and other injuries by persons or animals accounted for 16 percent of the nation’s workplace fatalities; in Pittsburgh, this event accounted for 22 percent of total fatalities.
Additional highlights:
Background of the program. The Census of Fatal Occupational Injuries (CFOI), part of the BLS Occupational Safety and Health Statistics (OSHS) program, compiles a count of all fatal work injuries occurring in the U.S. during the calendar year. The CFOI program uses diverse state, federal, and independent data sources to identify, verify, and describe fatal work injuries. This ensures counts are as complete and accurate as possible.
For technical information and definitions for CFOI, please go to the BLS Handbook of Methods on the BLS web site at www.bls.gov/opub/hom/pdf/homch9.pdf.
Federal/State agency coverage. The Census of Fatal Occupational Injuries includes data for all fatal work injuries, whether the decedent was working in a job covered by the Occupational Safety and Health Administration (OSHA) or other federal or state agencies or was outside the scope of regulatory coverage. Thus, any comparison between the BLS fatality census counts and those released by other agencies should take into account the different coverage requirements and definitions being used by each agency.
Acknowledgments. BLS thanks the Maryland Department of Labor, Licensing and Regulation for their efforts in collecting accurate, comprehensive, and useful data on fatal work injuries. BLS also appreciates the efforts of all federal, state, local, and private sector entities that provided source documents used to identify fatal work injuries.
The Pittsburgh, Pa. Metropolitan Statistical Area is composed of Allegheny, Armstrong, Beaver, Butler, Fayette, Washington and Westmoreland Counties in Pennsylvania.
Information in this release will be made available to sensory impaired individuals upon request. Voice phone: (202) 691-5200. Federal Relay Service: (800) 877-8339.
| Event or exposure(1) | 2013(2) | 2014(p) | |
|---|---|---|---|
| Number | Number | Percent | |
Total | 29 | 18 | 100 |
Violence and other injuries by persons or animals | 7 | 4 | 22 |
Intentional injury by person | 7 | 4 | 22 |
Homicides | 4 | 2 | 11 |
Shooting by other person--intentional | 4 | 2 | 11 |
Suicides | 3 | - | - |
Drug overdose--intentional self-harm | - | 1 | 6 |
Transportation incidents | 7 | 6 | 33 |
Rail vehicle incidents | - | 1 | 6 |
Pedestrian struck by rail vehicle--transportation incident | - | 1 | 6 |
Roadway incident involving motorized land vehicle | 2 | 4 | 22 |
Roadway collision with other vehicle | 1 | 2 | 11 |
Roadway collision moving in same direction | - | 1 | 6 |
Roadway collision moving perpendicularly | - | 1 | 6 |
Roadway collision with object other than vehicle | 1 | 1 | 6 |
Vehicle struck object or animal on side of roadway | 1 | 1 | 6 |
Roadway noncollision incident | - | 1 | 6 |
Jack-knifed or overturned, roadway | - | 1 | 6 |
Fall, slip, trip | 6 | 6 | 33 |
Fall to lower level | 5 | 4 | 22 |
Fall from collapsing structure or equipment | - | 1 | 6 |
Fall from collapsing structure or equipment 26 to 30 feet | - | 1 | 6 |
Fall through surface or existing opening | - | 1 | 6 |
Fall through surface or existing opening 16 to 20 feet | - | 1 | 6 |
Other fall to lower level | 3 | - | - |
Other fall to lower level 21 to 25 feet | - | 1 | 6 |
Exposure to harmful substances or environments | 5 | - | - |
Exposure to electricity | - | 1 | 6 |
Indirect exposure to electricity | - | 1 | 6 |
Indirect exposure to electricity, greater than 220 volts | - | 1 | 6 |
Footnotes: | |||
NOTE: Totals for major categories may include subcategories not shown separately. Percentages may not add to totals because of rounding. Dashes indicate no data reported or data that do not meet publication criteria. CFOI fatality counts exclude illness-related deaths unless precipitated by an injury event. | |||
| Industry(1) | 2013(2) | 2014(p) | |
|---|---|---|---|
| Number | Number | Percent | |
Total | 29 | 18 | 100 |
Private industry | 27 | 14 | 78 |
Goods producing | 10 | 5 | 28 |
Natural resources and mining | 1 | - | - |
Construction | 4 | 4 | 22 |
Construction of buildings | - | 3 | 17 |
Residential building construction | - | 3 | 17 |
Residential building construction | - | 3 | 17 |
Residential remodelers | - | 3 | 17 |
Specialty trade contractors | 2 | 1 | 6 |
Foundation, structure, and building exterior contractors | - | 1 | 6 |
Roofing contractors | - | 1 | 6 |
Residential roofing contractors | - | 1 | 6 |
Service providing | 17 | 9 | 50 |
Trade, transportation, and utilities | 10 | 4 | 22 |
Transportation and warehousing | 8 | 4 | 22 |
Truck transportation | 5 | 3 | 17 |
General freight trucking | 3 | 2 | 11 |
General freight trucking, long-distance | 3 | 2 | 11 |
General freight trucking, long-distance, truckload | 1 | 1 | 6 |
General freight trucking, long-distance, less than truckload | - | 1 | 6 |
Specialized freight trucking | - | 1 | 6 |
Specialized freight (except used goods) trucking, long-distance | - | 1 | 6 |
Financial activities | - | 1 | 6 |
Real estate and rental and leasing | - | 1 | 6 |
Real estate | - | 1 | 6 |
Lessors of real estate | - | 1 | 6 |
Lessors of nonresidential buildings (except miniwarehouses) | - | 1 | 6 |
Professional and business services | 4 | 2 | 11 |
Professional, scientific, and technical services | - | 1 | 6 |
Professional, scientific, and technical services | - | 1 | 6 |
Scientific research and development services | - | 1 | 6 |
Research and development in the physical, engineering, and life sciences | - | 1 | 6 |
Research and development in biotechnology | - | 1 | 6 |
Administrative and support and waste management and remediation services | 3 | 1 | 6 |
Administrative and support services | 3 | 1 | 6 |
Services to buildings and dwellings | 3 | 1 | 6 |
Landscaping services | - | 1 | 6 |
Educational and health services | - | - | - |
Health care and social assistance | - | - | - |
Social assistance | - | - | - |
Vocational rehabilitation services | - | 1 | 6 |
Vocational rehabilitation services | - | 1 | 6 |
Government(3) | - | 4 | 22 |
Federal government | - | 1 | 6 |
Service providing | - | 1 | 6 |
Public administration | - | 1 | 6 |
Justice, public order, and safety activities | - | 1 | 6 |
Justice, public order, and safety activities | - | 1 | 6 |
Police protection | - | 1 | 6 |
Local government | - | 3 | 17 |
Service providing | - | 3 | 17 |
Professional and business services | - | 1 | 6 |
Administrative and support and waste management and remediation services | - | 1 | 6 |
Waste management and remediation services | - | 1 | 6 |
Waste collection | - | 1 | 6 |
Waste collection | - | 1 | 6 |
Solid waste collection | - | 1 | 6 |
Public administration | - | 2 | 11 |
Justice, public order, and safety activities | - | 2 | 11 |
Justice, public order, and safety activities | - | 2 | 11 |
Police protection | - | 1 | 6 |
Fire protection | - | 1 | 6 |
Footnotes: | |||
NOTE: Totals for major categories may include subcategories not shown separately. Percentages may not add to totals because of rounding. Dashes indicate no data reported or data that do not meet publication criteria. CFOI fatality counts exclude illness-related deaths unless precipitated by an injury event. | |||
| Occupation(1) | 2013(2) | 2014(p) | |
|---|---|---|---|
| Number | Number | Percent | |
Total | 29 | 18 | 100 |
Management, business, science, and arts occupations | 6 | 3 | 17 |
Management, business, and financial occupations | 4 | - | - |
Management occupations | 4 | - | - |
Other management occupations | - | - | - |
Property, real estate, and community association managers | - | 1 | 6 |
Property, real estate, and community association managers | - | 1 | 6 |
Professional and related occupations | - | 1 | 6 |
Computer, engineering, and science occupations | - | 1 | 6 |
Life, physical, and social science occupations | - | 1 | 6 |
Life scientists | - | 1 | 6 |
Biological scientists | - | 1 | 6 |
Microbiologists | - | 1 | 6 |
Service occupations | 4 | 6 | 33 |
Protective service occupations | - | 3 | 17 |
Fire fighting and prevention workers | - | 1 | 6 |
Firefighters | - | 1 | 6 |
Firefighters | - | 1 | 6 |
Law enforcement workers | - | 2 | 11 |
Police officers | - | 2 | 11 |
Police and sheriff's patrol officers | - | 2 | 11 |
Building and grounds cleaning and maintenance occupations | 4 | 2 | 11 |
Building cleaning and pest control workers | - | 1 | 6 |
Building cleaning workers | - | 1 | 6 |
Janitors and cleaners, except maids and housekeeping cleaners | - | 1 | 6 |
Grounds maintenance workers | - | 1 | 6 |
Grounds maintenance workers | - | 1 | 6 |
Tree trimmers and pruners | - | 1 | 6 |
Natural resources, construction, and maintenance occupations | 6 | 5 | 28 |
Construction and extraction occupations | 3 | 5 | 28 |
Supervisors of construction and extraction workers | - | 1 | 6 |
First-line supervisors/managers of construction trades and extraction workers | - | 1 | 6 |
First-line supervisors of construction trades and extraction workers | - | 1 | 6 |
Construction trades workers | - | 4 | 22 |
Roofers | - | 1 | 6 |
Roofers | - | 1 | 6 |
Production, transportation, and material moving occupations | 12 | 4 | 22 |
Transportation and material moving occupations | 10 | 4 | 22 |
Motor vehicle operators | 8 | 3 | 17 |
Driver/sales workers and truck drivers | 5 | 3 | 17 |
Heavy and tractor-trailer truck drivers | 4 | 3 | 17 |
Material moving workers | - | 1 | 6 |
Refuse and recyclable material collectors | - | 1 | 6 |
Refuse and recyclable material collectors | - | 1 | 6 |
Footnotes: | |||
NOTE: Totals for major categories may include subcategories not shown separately. Percentages may not add to totals because of rounding. Dashes indicate no data reported or data that do not meet publication criteria. CFOI fatality counts exclude illness-related deaths unless precipitated by an injury event. | |||
| Characteristic | 2013(1) | 2014(p) | |
|---|---|---|---|
| Number | Number | Percent | |
Total | 29 | 18 | 100 |
| Employee status | |||
Wage and salary workers(2) | 20 | 14 | 78 |
Self-employed(3) | 9 | 4 | 22 |
| Gender | |||
Women | 1 | 2 | 11 |
Men | 28 | 16 | 89 |
| Age(4) | |||
20 to 24 years | - | 1 | 6 |
25 to 34 years | 2 | 1 | 6 |
35 to 44 years | 2 | 4 | 22 |
45 to 54 years | 12 | 4 | 22 |
55 to 64 years | 7 | 7 | 39 |
65 years and over | 6 | 1 | 6 |
| Race or ethnic origin(5) | |||
White (non-Hispanic) | 23 | 16 | 89 |
Footnotes: | |||
NOTE: Totals for major categories may include subcategories not shown separately. Percentages may not add to totals because of rounding. Dashes indicate no data reported or data that do not meet publication criteria. CFOI fatality counts exclude illness-related deaths unless precipitated by an injury event. | |||
Last Modified Date: Thursday, January 21, 2016