An official website of the United States government
An official website of the United States government
The .gov means it's official.
Federal government websites often end in .gov or .mil. Before sharing sensitive information,
make sure you're on a federal government site.
The site is secure.
The
https:// ensures that you are connecting to the official website and that any
information you provide is encrypted and transmitted securely.
17-465-PHI
Thursday, April 20, 2017
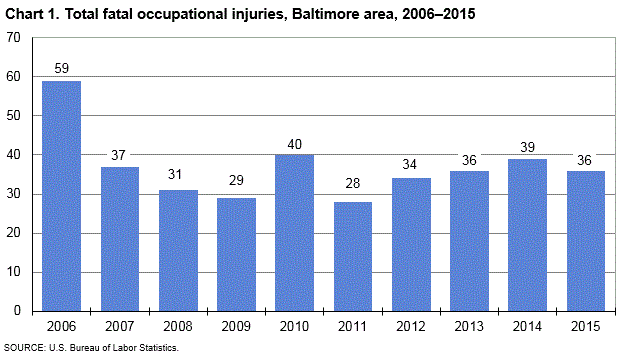
Fatal work injuries totaled 36 in 2015 for the Baltimore-Columbia-Towson, Md. Metropolitan Statistical Area, the U.S. Bureau of Labor Statistics reported today. Sheila Watkins, the Bureau’s regional commissioner, noted that the number of work-related fatalities in the Baltimore area decreased by three from the previous year. Fatal occupational injuries in the area have ranged from a high of 59 in 2006 to a low of 28 in 2011. (See chart 1.)
Nationwide, a total of 4,836 fatal work injuries were recorded in 2015, a slight increase from the 4,821 fatal injuries in 2014, according to the results from the Census of Fatal Occupational Injuries (CFOI) program.
Type of incident
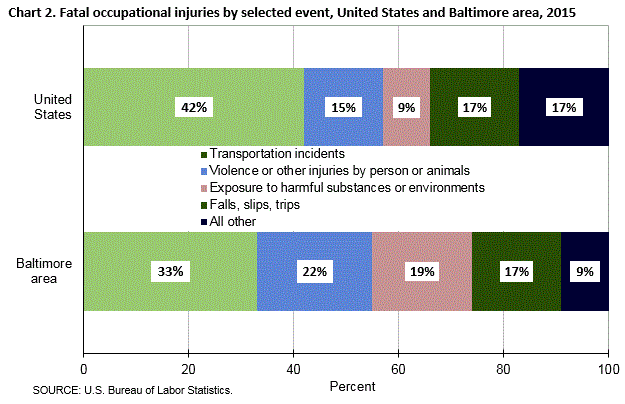
In the Baltimore area, transportation incidents resulted in 12 fatal work injuries and violence and other injuries by persons or animals accounted for 8 fatalities. These two major categories accounted for 56 percent of all workplace fatalities in the Baltimore area. (See table 1.) The number of worker deaths from transportation incidents increased by three over the year and worker fatalities due to violence and other injuries by persons or animals decreased by seven over the year.
Exposure to harmful substances or environments was the third-most frequent fatal work event with seven fatalities, compared to six fatalities in 2014. Falls, slips, or trips resulted in six work-related deaths, down from eight in 2014.
Nationally, transportation incidents was the most frequent fatal workplace event in 2015, accounting for approximately 42 percent of fatal work injuries. (See chart 2.) Falls, slips, or trips was the second-most frequent type of event, with 17 percent of work-related fatalities, followed by contact with objects and equipment (15 percent) and violence and other injuries by persons or animals (15 percent).
Industry
The private construction industry sector had the largest number of fatalities in the Baltimore area with 13, up from 8 in the previous year. (See table 2.) Falls to a lower level was the most frequent fatal event in the construction sector with five worker deaths, followed by exposure to other harmful substances with three fatalities. Sixty-two percent of those fatally injured in this sector worked in specialty trade contracting.
The other services, except public administration sector within private industry had five workplace fatalities. Repair and maintenance accounted for three of the five fatal injuries in this industry.
Occupation
Construction and extraction occupations and transportation and material moving occupations had the highest number of workplace fatalities with 12 and 8, respectively. (See table 3.) The majority of the fatalities within the construction and extraction group were construction trades workers, with 10 worker deaths. Motor vehicle operators accounted for 5 of the 8 fatalities among transportation and material moving workers.
Contracted Workers
A contracted worker is defined as a worker employed by one firm but working at the behest of another firm that exercises overall responsibility for the operations at the site of the fatal injury. In 2015, the Baltimore area had nine fatally-injured workers identified as fitting the contracted worker criteria; of those, three were the result of falls to a lower level.
Additional highlights
Beginning with the 2015 reference year, CFOI will publish a single, annual release with no revisions. A similar schedule will be followed in subsequent years. Preliminary releases, which normally appeared in August or September in past years, will no longer be produced.
Background of the program. The Census of Fatal Occupational Injuries (CFOI), part of the BLS Occupational Safety and Health Statistics (OSHS) program, compiles a count of all fatal work injuries occurring in the U.S. during the calendar year. The CFOI program uses diverse state, federal, and independent data sources to identify, verify, and describe fatal work injuries. This ensures counts are as complete and accurate as possible. For technical information and definitions for CFOI, please go to the BLS Handbook of Methods on the BLS web site at https://www.bls.gov/opub/hom/pdf/homch9.pdf.
Federal/State agency coverage. The Census of Fatal Occupational Injuries includes data for all fatal work injuries, whether the decedent was working in a job covered by the Occupational Safety and Health Administration (OSHA) or other federal or state agencies or was outside the scope of regulatory coverage. Thus, any comparison between the BLS fatality census counts and those released by other agencies should take into account the different coverage requirements and definitions being used by each agency.
Acknowledgments. BLS thanks the Maryland Department of Labor, Licensing and Regulation for their efforts in collecting accurate, comprehensive, and useful data on fatal work injuries. BLS also appreciates the efforts of all federal, state, local, and private sector entities that provided source documents used to identify fatal work injuries. Among these agencies are the Occupational Safety and Health Administration; the National Transportation Safety Board; the U.S. Coast Guard; the Mine Safety and Health Administration; the Office of Workers’ Compensation Programs (Federal Employees' Compensation and Longshore and Harbor Workers' Compensation divisions); the Federal Railroad Administration; the National Highway Traffic Safety Administration; state vital statistics registrars, coroners, and medical examiners; state departments of health, labor, and industrial relations and workers' compensation agencies; state and local police departments; and state farm bureaus.
Area definitions. The substate area data published in this release reflect the standards and definitions established by the U.S. Office of Management and Budget, dated February 2013. A detailed list of the geographic definitions is available at https://www.bls.gov/lau/lausmsa.htm.
The Baltimore-Columbia-Towson, Md. Metropolitan Statistical Area (MSA) consists of Anne Arundel, Baltimore, Carroll, Harford, Howard, and Queen Anne’s Counties and Baltimore City in Maryland.
Information in this release is available to sensory-impaired individuals. Voice phone: (202) 691-5200; Federal Relay Service: (800) 877-8339.
| Event or exposure(1) | 2014 | 2015 | |
|---|---|---|---|
| Number | Number | Percent | |
Total | 39 | 36 | 100 |
Violence and other injuries by persons or animals | 15 | 8 | 22 |
Intentional injury by person | 13 | 7 | 19 |
Homicides | 11 | 6 | 17 |
Shooting by other person--intentional | 8 | 5 | 14 |
Stabbing, cutting, slashing, piercing | 3 | 1 | 3 |
Injury by person--unintentional or intent unknown | - | 1 | 3 |
Injury by other person--unintentional or intent unknown | - | 1 | 3 |
Shooting by other person--unintentional | - | 1 | 3 |
Transportation incidents | 9 | 12 | 33 |
Pedestrian vehicular incident | 2 | 4 | 11 |
Pedestrian struck by vehicle on side of road | - | 2 | 6 |
Pedestrian struck by forward-moving vehicle on side of road | - | 2 | 6 |
Pedestrian struck by vehicle in nonroadway area | - | 1 | 3 |
Pedestrian struck by forward-moving vehicle in nonroadway area | - | 1 | 3 |
Roadway incident involving motorized land vehicle | 5 | 7 | 19 |
Roadway collision with other vehicle | 1 | 4 | 11 |
Roadway collision moving in same direction | - | 1 | 3 |
Roadway collision moving in opposite directions, oncoming | - | 2 | 6 |
Roadway collision moving perpendicularly | - | 1 | 3 |
Roadway collision with object other than vehicle | 3 | 3 | 8 |
Vehicle struck object or animal on side of roadway | 3 | 3 | 8 |
Nonroadway incident involving motorized land vehicle | - | 1 | 3 |
Nonroadway collision with other vehicle | - | 1 | 3 |
Collision between a moving and standing vehicle, nonroadway | - | 1 | 3 |
Fall, slip, trip | 8 | 6 | 17 |
Fall to lower level | 7 | 6 | 17 |
Fall from collapsing structure or equipment | 1 | - | - |
Fall from collapsing structure or equipment more than 30 feet | 1 | 2 | 6 |
Fall through surface or existing opening | 2 | 1 | 3 |
Fall through surface or existing opening more than 30 feet | - | 1 | 3 |
Other fall to lower level | 4 | - | - |
Other fall to lower level 16 to 20 feet | - | 1 | 3 |
Exposure to harmful substances or environments | 1 | 7 | 19 |
Exposure to other harmful substances | 1 | 6 | 17 |
Nonmedical use of drugs or alcohol unintentional overdose | - | 4 | 11 |
Contact with objects and equipment | 6 | 3 | 8 |
Struck by object or equipment | 5 | 1 | 3 |
Struck by falling object or equipment | - | 1 | 3 |
Struck by object falling from vehicle or machinery other than vehicle part | - | 1 | 3 |
Footnotes: | |||
Note: Data for all years are revised and final. Totals for major categories may include subcategories not shown separately. Percentages may not add to totals because of rounding. CFOI fatal injury counts exclude illness-related deaths unless precipitated by an injury event. Dashes indicate no data reported or data that do not meet publication criteria. | |||
| Industry(1) | 2014 | 2015 | |
|---|---|---|---|
| Number | Number | Percent | |
Total | 39 | 36 | 100 |
Private industry | 37 | 32 | 89 |
Goods producing | 9 | 14 | 39 |
Construction | 8 | 13 | 36 |
Heavy and civil engineering construction | - | 2 | 6 |
Highway, street, and bridge construction | - | 2 | 6 |
Highway, street, and bridge construction | - | 2 | 6 |
Specialty trade contractors | 8 | 8 | 22 |
Foundation, structure, and building exterior contractors | 4 | 3 | 8 |
Poured concrete foundation and structure contractors | 1 | 1 | 3 |
Framing contractors | - | 2 | 6 |
Nonresidential framing contractors | - | 1 | 3 |
Building equipment contractors | - | 4 | 11 |
Service providing | 28 | 18 | 50 |
Trade, transportation, and utilities | 12 | 7 | 19 |
Wholesale trade | - | 2 | 6 |
Merchant wholesalers, durable goods | - | 1 | 3 |
Hardware, and plumbing and heating equipment and supplies merchant wholesalers | - | 1 | 3 |
Plumbing and heating equipment and supplies (hydronics) merchant wholesalers | - | 1 | 3 |
Merchant wholesalers, nondurable goods | - | 1 | 3 |
Beer, wine, and distilled alcoholic beverage merchant wholesalers | - | 1 | 3 |
Wine and distilled alcoholic beverage merchant wholesalers | - | 1 | 3 |
Retail trade | 6 | 1 | 3 |
Food and beverage stores | 1 | 1 | 3 |
Grocery stores | 1 | 1 | 3 |
Convenience stores | 1 | 1 | 3 |
Transportation and warehousing | 5 | 4 | 11 |
Truck transportation | - | 4 | 11 |
Professional and business services | 8 | 1 | 3 |
Administrative and support and waste management and remediation services | 6 | 1 | 3 |
Administrative and support services | 6 | 1 | 3 |
Services to buildings and dwellings | 6 | 1 | 3 |
Landscaping services | 4 | 1 | 3 |
Leisure and hospitality | 4 | 5 | 14 |
Arts, entertainment, and recreation | - | 2 | 6 |
Performing arts, spectator sports, and related industries | - | 1 | 3 |
Spectator sports | - | 1 | 3 |
Spectator sports | - | 1 | 3 |
Racetracks | - | 1 | 3 |
Amusement, gambling, and recreation industries | - | 1 | 3 |
Other amusement and recreation industries | - | 1 | 3 |
Accommodation and food services | 4 | 3 | 8 |
Accommodation | - | 1 | 3 |
RV (recreational vehicle) parks and recreational camps | - | 1 | 3 |
RV (recreational vehicle) parks and recreational camps | - | 1 | 3 |
Recreational and vacation camps (except campgrounds) | - | 1 | 3 |
Food services and drinking places | 4 | 2 | 6 |
Restaurants and other eating places | 3 | 2 | 6 |
Restaurants and other eating places | 3 | 2 | 6 |
Limited-service restaurants | 1 | 1 | 3 |
Snack and nonalcoholic beverage bars | - | 1 | 3 |
Other services, except public administration | - | 5 | 14 |
Repair and maintenance | - | 3 | 8 |
Automotive repair and maintenance | - | 3 | 8 |
Other automotive repair and maintenance | - | 1 | 3 |
Car washes | - | 1 | 3 |
Government (2) | 2 | 4 | 11 |
State government | - | 1 | 3 |
Goods-producing | - | 1 | 3 |
Construction | - | 1 | 3 |
Heavy and civil engineering construction | - | 1 | 3 |
Highway, street, and bridge construction | - | 1 | 3 |
Highway, street, and bridge construction | - | 1 | 3 |
Local government | 1 | 3 | 8 |
Service-providing | 1 | 3 | 8 |
Public administration | 1 | 3 | 8 |
Justice, public order, and safety activities | 1 | 3 | 8 |
Justice, public order, and safety activities | 1 | 3 | 8 |
Police protection | - | 1 | 3 |
Fire protection | 1 | 2 | 6 |
Footnotes: | |||
NOTE: Data for all years are revised and final. Totals for major categories may include subcategories not shown separately. Percentages may not add to totals because of rounding. CFOI fatal injury counts exclude illness-related deaths unless precipitated by an injury event. Dashes indicate no data reported or data that do not meet publication criteria. | |||
| Occupation(1) | 2014 | 2015 | |
|---|---|---|---|
| Number | Number | Percent | |
Total | 39 | 36 | 100 |
Management, business, science, and arts occupations | - | 2 | 6 |
Professional and related occupations | - | 2 | 6 |
Healthcare practitioners and technical occupations | - | 2 | 6 |
Health technologists and technicians | - | 2 | 6 |
Emergency medical technicians and paramedics | - | 2 | 6 |
Emergency medical technicians and paramedics | - | 2 | 6 |
Service occupations | 14 | 7 | 19 |
Protective service occupations | 3 | 2 | 6 |
Law enforcement workers | - | 1 | 3 |
Police officers | - | 1 | 3 |
Police and sheriff's patrol officers | - | 1 | 3 |
Other protective service workers | 2 | 1 | 3 |
Security guards and gaming surveillance officers | 1 | 1 | 3 |
Security guards | 1 | 1 | 3 |
Food preparation and serving related occupations | - | 1 | 3 |
Food and beverage serving workers | - | 1 | 3 |
Fast food and counter workers | - | 1 | 3 |
Counter attendants, cafeteria, food concession, and coffee shop | - | 1 | 3 |
Building and grounds cleaning and maintenance occupations | 7 | 2 | 6 |
Grounds maintenance workers | 5 | 2 | 6 |
Grounds maintenance workers | 5 | 2 | 6 |
Landscaping and groundskeeping workers | 4 | 2 | 6 |
Personal care and service occupations | 1 | - | - |
Entertainment attendants and related workers | - | 1 | 3 |
Miscellaneous entertainment attendants and related workers | - | 1 | 3 |
Amusement and recreation attendants | - | 1 | 3 |
Sales and office occupations | 4 | 1 | 3 |
Sales and related occupations | 4 | 1 | 3 |
Supervisors, sales workers | - | 1 | 3 |
First-line supervisors/managers, sales workers | - | 1 | 3 |
First-line supervisors of retail sales workers | - | 1 | 3 |
Natural resources, construction, and maintenance occupations | 9 | 15 | 42 |
Farming, fishing, and forestry occupations | - | 1 | 3 |
Fishing and hunting workers | - | 1 | 3 |
Hunters and trappers | - | 1 | 3 |
Hunters and trappers | - | 1 | 3 |
Construction and extraction occupations | 6 | 12 | 33 |
Construction trades workers | 4 | 10 | 28 |
Carpenters | - | 3 | 8 |
Carpenters | - | 3 | 8 |
Production, transportation, and material moving occupations | 10 | 11 | 31 |
Production occupations | - | 3 | 8 |
Transportation and material moving occupations | 9 | 8 | 22 |
Motor vehicle operators | 8 | 5 | 14 |
Driver/sales workers and truck drivers | 5 | 4 | 11 |
Driver/sales workers | - | 1 | 3 |
Material moving workers | - | 3 | 8 |
Industrial truck and tractor operators | - | 2 | 6 |
Industrial truck and tractor operators | - | 2 | 6 |
Footnotes: | |||
NOTE: Data for all years are revised and final. Totals for major categories may include subcategories not shown separately. Percentages may not add to totals because of rounding. CFOI fatal injury counts exclude illness-related deaths unless precipitated by an injury event. Dashes indicate no data reported or data that do not meet publication criteria. | |||
| Worker characteristics | 2014 | 2015 | |
|---|---|---|---|
| Number | Number | Percent | |
Total | 39 | 36 | 100 |
| Employee status | |||
Wage and salary workers(1) | 33 | 30 | 83 |
Self-employed(2) | 6 | 6 | 17 |
| Gender | |||
Women | 6 | 2 | 6 |
Men | 33 | 34 | 94 |
| Age | |||
20 to 24 years | 5 | 4 | 11 |
25 to 34 years | 3 | 13 | 36 |
35 to 44 years | 8 | 5 | 14 |
45 to 54 years | 11 | 7 | 19 |
55 to 64 years | 7 | 4 | 11 |
65 years and over | 5 | 3 | 8 |
| Race or ethnic origin(3) | |||
White (non-Hispanic) | 21 | 19 | 53 |
Black or African-American (non-Hispanic) | 11 | 7 | 19 |
Hispanic or Latino | 4 | 6 | 17 |
Asian (non-Hispanic) | 3 | 4 | 11 |
Footnotes: | |||
NOTE: Data for all years are revised and final. Totals for major categories may include subcategories not shown separately. Percentages may not add to totals because of rounding. CFOI fatal injury counts exclude illness-related deaths unless precipitated by an injury event. Dashes indicate no data reported or data that do not meet publication criteria. | |||
Last Modified Date: Thursday, April 20, 2017