An official website of the United States government
An official website of the United States government
The .gov means it's official.
Federal government websites often end in .gov or .mil. Before sharing sensitive information,
make sure you're on a federal government site.
The site is secure.
The
https:// ensures that you are connecting to the official website and that any
information you provide is encrypted and transmitted securely.
18-1852-PHI
Thursday, November 15, 2018
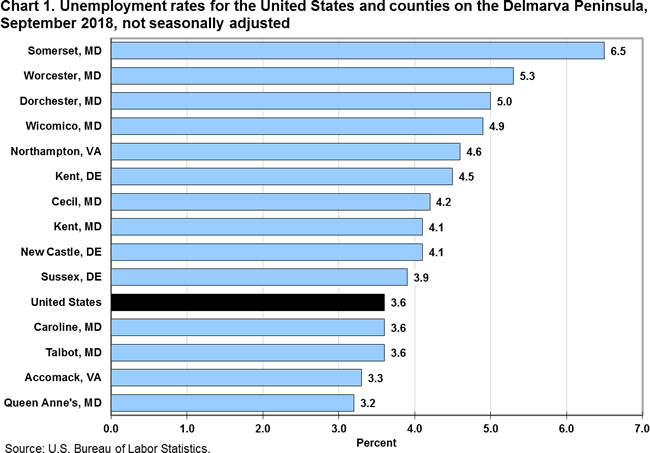
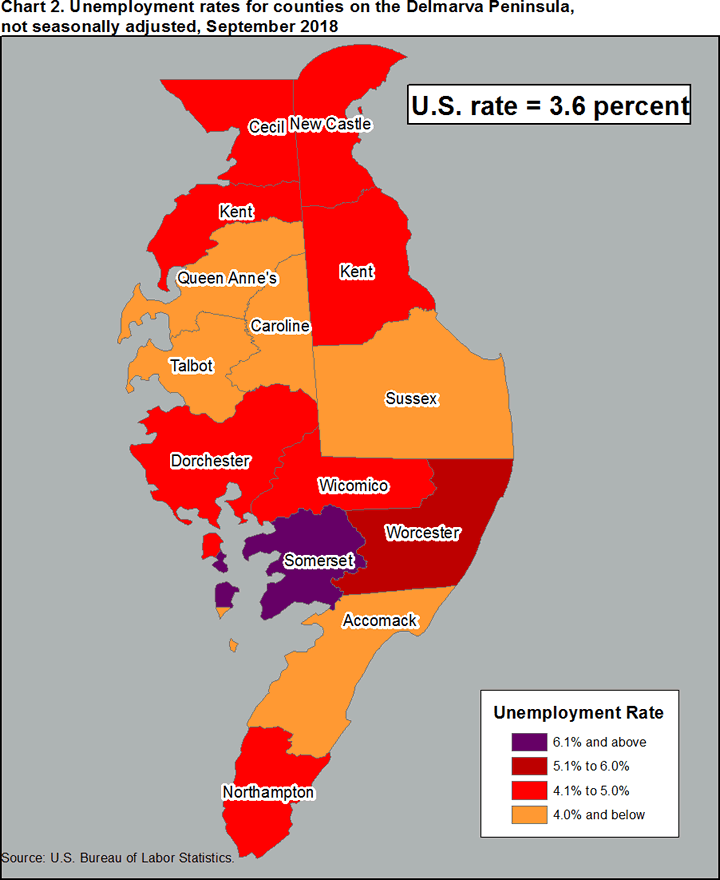
In September, Somerset County, MD, had the highest unemployment rate on the Delmarva Peninsula at 6.5 percent, the U.S. Bureau of Labor Statistics reported today. Sheila Watkins, the Bureau’s regional commissioner, noted that 10 of the 14 Delmarva Peninsula counties had jobless rates higher than the 3.6-percent U.S. average. Among the four remaining counties, two had jobless rates below the national rate, and two had rates that were equal to that of the nation. (See chart 1 and chart 2. All data in this release are not seasonally adjusted; accordingly, over-the-year analysis is used throughout.)
Eight of the 14 counties on the Delmarva Peninsula had unemployment rate decreases from September 2017 to September 2018. (See table A.) Accomack County, VA, had the largest over-the-year decrease, 0.9 percentage point, and was the only local county with a decrease that exceeded the national decline of 0.5 point. Five local counties had unemployment rate increases since September 2017, with the largest increase in Somerset, MD (+0.5 percentage point). Dorchester, MD, had a jobless rate that was unchanged over the year.
Area | Back data | Unemployment rates | Change from | |||
|---|---|---|---|---|---|---|
| Sep 2016 | Sep 2017 | Sep 2018(1) | Sep 2016 to Sep 2018(1) | Sep 2017 to Sep 2018(1) | ||
United States | 4.8 | 4.1 | 3.6 | -1.2 | -0.5 | |
Delaware | 4.5 | 4.5 | 4.1 | -0.4 | -0.4 | |
Kent | 4.9 | 4.8 | 4.5 | -0.4 | -0.3 | |
New Castle | 4.5 | 4.5 | 4.1 | -0.4 | -0.4 | |
Sussex | 4.2 | 4.1 | 3.9 | -0.3 | -0.2 | |
Maryland | 4.3 | 3.9 | 3.9 | -0.4 | 0.0 | |
Caroline | 4.5 | 3.7 | 3.6 | -0.9 | -0.1 | |
Cecil | 4.9 | 4.3 | 4.2 | -0.7 | -0.1 | |
Dorchester | 5.7 | 5.0 | 5.0 | -0.7 | 0.0 | |
Kent | 4.5 | 3.8 | 4.1 | -0.4 | 0.3 | |
Queen Anne's | 3.7 | 3.4 | 3.2 | -0.5 | -0.2 | |
Somerset | 6.5 | 6.0 | 6.5 | 0.0 | 0.5 | |
Talbot | 3.9 | 3.5 | 3.6 | -0.3 | 0.1 | |
Wicomico | 5.7 | 4.8 | 4.9 | -0.8 | 0.1 | |
Worcester | 6.0 | 5.1 | 5.3 | -0.7 | 0.2 | |
Virginia | 4.2 | 3.6 | 2.8 | -1.4 | -0.8 | |
Accomack | 4.7 | 4.2 | 3.3 | -1.4 | -0.9 | |
Northampton | 5.2 | 5.0 | 4.6 | -0.6 | -0.4 | |
Footnotes | ||||||
Jobless rates in 13 Delmarva Peninsula counties in September 2018 were lower than in September 2016. Accomack County, VA, had the largest two-year jobless rate decrease (-1.4 percentage points) and was the only county with a decrease larger than the national decline of 1.2 percentage points. The jobless rate in Somerset County, MD, was unchanged during the two-year period.
The Metropolitan Area Employment and Unemployment news release for October is scheduled to be released on Thursday, November 29, 2018, at 10:00 a.m. (EDT).
This release presents unemployment rate data for states and counties from the Local Area Unemployment Statistics (LAUS) program, a federal-state cooperative endeavor.
Definitions. The labor force and unemployment data are based on the same concepts and definitions as those used for the official national estimates obtained from the Current Population Survey (CPS), a sample survey of households that is conducted for the Bureau of Labor Statistics (BLS) by the U.S. Census Bureau. The LAUS program measures employment and unemployment on a place-of-residence basis. The universe for each is the civilian noninstitutional population 16 years of age and over. Employed persons are those who did any work at all for pay or profit in the reference week (the week including the 12th of the month) or worked 15 hours or more without pay in a family business or farm, plus those not working who had a job from which they were temporarily absent, whether or not paid, for such reasons as labor-management dispute, illness, or vacation. Unemployed persons are those who were not employed during the reference week (based on the definition above), had actively looked for a job sometime in the 4-week period ending with the reference week, and were currently available for work; persons on layoff expecting recall need not be looking for work to be counted as unemployed. The labor force is the sum of employed and unemployed persons. The unemployment rate is the number of unemployed as a percent of the labor force.
Methods of Estimation. The LAUS program is a hierarchy of non-survey methodologies for indirectly estimating employment and unemployment in states and local areas. Statewide data are produced through a modeling technique that uses estimates of payroll jobs from the Current Employment Statistics survey and unemployment insurance claims counts from the state workforce agencies to mitigate volatility in the direct CPS tabulations of employment and unemployment, respectively. Data for counties are developed through a building-block approach and adjusted proportionally to state model-based totals. For multi-county areas, such as the metropolitan areas and metropolitan divisions delineated by the Office of Management and Budget, estimates are summed from the data for their component counties. Estimates for cities and towns are produced through a disaggregation technique. A detailed description of the LAUS estimation procedures is available in chapter 4 of the BLS Handbook of Methods at www.bls.gov/opub/hom/lau/pdf/lau.pdf.
Annual revisions. Labor force and unemployment data for prior years reflect adjustments made at the end of each year, usually implemented with January estimates. The adjusted estimates reflect updated population data from the U.S. Census Bureau, any revisions in the other data sources, and model reestimation. All substate estimates are reestimated and adjusted to add to the revised model-based estimates.
The Delmarva Peninsula, located on the east coast of the United States, comprises Delaware and portions of Maryland and Virginia. The Delmarva Peninsula includes Kent, New Castle, and Sussex Counties in Delaware; Caroline, Cecil, Dorchester, Kent, Queen Anne’s, Somerset, Talbot, Wicomico, and Worcester Counties in Maryland; and Accomack and Northampton Counties in Virginia.
Information in this release will be made available to sensory impaired individuals upon request. Voice phone: (202) 691-5200; Federal Relay Service: (800) 877-8339.
Last Modified Date: Thursday, November 15, 2018