An official website of the United States government
An official website of the United States government
The .gov means it's official.
Federal government websites often end in .gov or .mil. Before sharing sensitive information,
make sure you're on a federal government site.
The site is secure.
The
https:// ensures that you are connecting to the official website and that any
information you provide is encrypted and transmitted securely.
20-1177-PHI
Thursday, June 04, 2020
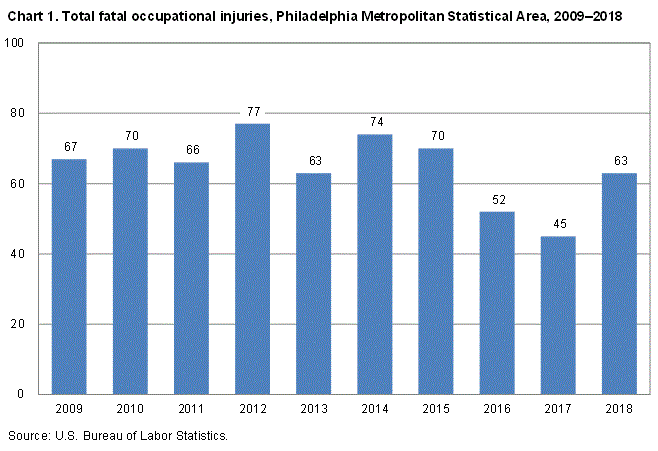
Fatal work injuries totaled 63 in 2018 for the Philadelphia-Camden-Wilmington, PA-NJ-DE-MD Metropolitan Statistical Area, the U.S. Bureau of Labor Statistics reported today. Sheila Watkins, the Bureau’s regional commissioner, noted that the number of work-related fatalities in the Philadelphia metropolitan area increased by 18 from the previous year’s record low. Fatal occupational injuries in the metropolitan area have ranged from a high of 93 in 2004 and 2007 to a low of 45 in 2017. (See chart 1.)
Nationwide, a total of 5,250 fatal work injuries were recorded in 2018, up from the 5,147 fatal injuries in 2017, according to the results from the Census of Fatal Occupational Injuries (CFOI) program.
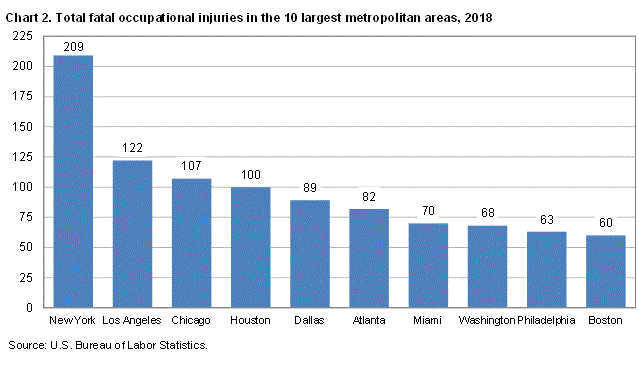
In 2018, the Philadelphia area had the seventh-largest population nationally[1] and had the second-lowest number of work-related fatalities among the 10 largest metropolitan statistical areas in the United States. (See table 1 and chart 2.) The most populated metropolitan area in the country—New York—had the highest number of workplace fatalities (209) in 2018. The smallest of the 10 metropolitan areas—Boston—had the lowest fatality count with 60 deaths.
Type of incident
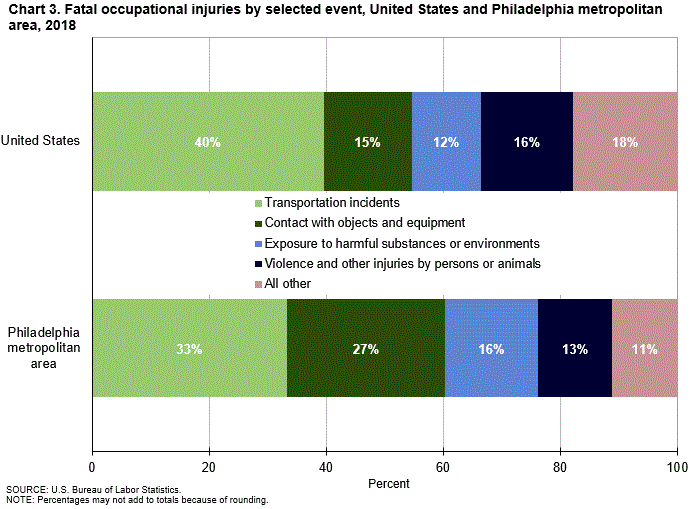
In the Philadelphia metropolitan area, transportation incidents resulted in 21 fatal work injuries, followed by contact with objects and equipment which accounted for 17 fatalities 2018. (See table 1 and table 2.) These two major categories accounted for three-fifths of all workplace fatalities in the Philadelphia area. The share of total fatalities due to transportation incidents in Philadelphia (33 percent) ranked third among the 10 largest metropolitan areas in the nation behind Atlanta (40 percent) and Dallas (37 percent). Contact with objects and equipment made up 27 percent of the Philadelphia area’s share of total fatalities during 2018 and ranked highest among the 10 largest areas.
Exposure to harmful substances or environments was the third-most frequent fatal work event in the Philadelphia area with 10 fatalities during 2018, an increase of 3 from the previous year. The Philadelphia area’s 16-percent share in this category ranked fourth among the 10 largest areas.
Nationally, transportation incidents was the most frequent fatal workplace event in 2018, accounting for 40 percent of fatal work injuries. (See chart 3.) Violence and other injuries by persons or animals was the second-most common fatal event (16 percent), followed by falls, slips, and trips (15 percent) and contact with objects and equipment (15 percent).
Industry
The private transportation and warehousing industry sector had the largest number of fatalities in the Philadelphia area with 16, up from 9 the previous year. (See table 3.) Roadway incidents involving motorized land vehicles was the most frequent fatal event in this sector with five worker deaths. Six of those fatally injured in the transportation and warehousing industry sector worked in general freight trucking.
The private construction and administrative and support and waste management and remediation services industries each accounted for 13 work-related fatalities during 2018. Specialty trade contractors made up 12 of the construction industry fatalities. The administrative and support and waste management and remediation services industry count was up from 4 reported fatalities the previous year, with 7 of the 13 fatalities occurring in landscaping services during 2018.
Occupation
Transportation and material moving occupations and construction and extraction occupations had the highest number of workplace fatalities with 25 and 14, respectively. (See table 4.) Forty-eight percent of the fatalities within the transportation and material moving group were heavy and tractor-trailer truck drivers (12). Construction laborers accounted for 8 of the 14 fatalities among construction and extraction workers.
Contracted Workers
A contractor is defined as a worker employed by one firm but working at the behest of another firm that exercises overall responsibility for the operations at the site of the fatal injury. In 2018, the Philadelphia area had 11 fatally-injured workers identified as fitting the contractor criteria; of those, four were the result of being struck by an object or equipment.
Additional highlights
Men accounted for 92 percent of the work-related fatalities in the Philadelphia area, equal to the national share. (See table 5.) Transportation incidents made up 34 percent of the fatalities for men in the Philadelphia area. Three of the five women fatally injured in the Philadelphia area during 2018 died as a result of violence and other injuries by persons or animals.
White, non-Hispanic workers accounted for 51 percent of those who died from a workplace injury. Nationwide, this group accounted for 65 percent of work-related deaths. Black or African-American, non-Hispanic workers made up 24 percent of fatal work injuries in the Philadelphia metropolitan area, compared with 12 percent nationwide.
Workers 25-54 years old accounted for 62 percent of the area’s work-related fatalities in 2018, compared to 58 percent of on-the-job fatalities nationally.
Of the 63 fatally-injured workers in the Philadelphia area, 76 percent worked for wages and salaries; the remainder were self-employed. Transportation incidents was the most frequent fatal event for wage and salary workers, while contact with objects and equipment accounted for 6 of the 15 self-employed worker fatalities.
Ten, or 16 percent, of workplace fatalities in the Philadelphia area occurred between 1:00PM and 1:59PM, compared to 6 percent nationwide.
[1] Metropolitan area populations based on 2015 estimates from the Census Bureau.
Background of the program. The Census of Fatal Occupational Injuries (CFOI), part of the Bureau of Labor Statistics (BLS) Occupational Safety and Health Statistics (OSHS) program, compiles a count of all fatal work injuries occurring in the U.S. during the calendar year. The CFOI program uses diverse state, federal, and independent data sources to identify, verify, and describe fatal work injuries. This ensures counts are as complete and accurate as possible. For the 2017 national data, over 23,400 unique source documents were reviewed as part of the data collection process. For technical information and definitions for CFOI, please go to the BLS Handbook of Methods on the BLS website at www.bls.gov/opub/hom/cfoi/home.htm.
Federal/State agency coverage. The CFOI includes data for all fatal work injuries, even those that may be outside the scope of other agencies or regulatory coverage. Thus, any comparison between the BLS fatality census counts and those released by other agencies should take into account the different coverage requirements and definitions being used by each agency. More on the scope of CFOI can be found at www.bls.gov/iif/cfoiscope.htm and www.bls.gov/opub/hom/cfoi/concepts.htm.
Acknowledgments. BLS thanks the Pennsylvania Department of Health; New Jersey Department of Health; Delaware Department of Labor; and Maryland Department of Labor, Licensing and Regulation for their efforts in collecting accurate, comprehensive, and useful data on fatal work injuries. BLS also appreciates the efforts of all federal, state, local, and private sector entities that provided source documents used to identify fatal work injuries. Among these agencies are the Occupational Safety and Health Administration; the National Transportation Safety Board; the U.S. Coast Guard; the Mine Safety and Health Administration; the Office of Workers’ Compensation Programs (Federal Employees' Compensation and Longshore and Harbor Workers' Compensation divisions); the Federal Railroad Administration; the National Highway Traffic Safety Administration; state vital statistics registrars, coroners, and medical examiners; state departments of health, labor, and industrial relations and workers' compensation agencies; state and local police departments; and state farm bureaus.
Area definitions. The substate area data published in this release reflect the standards and definitions established by the U.S. Office of Management and Budget, Bulletin Number 13-01, February 2013. A detailed list of the geographic definitions is available at www.bls.gov/lau/lausmsa.htm.
The Philadelphia-Camden-Wilmington, PA-NJ-DE-MD Metropolitan Statistical Area consists of the Camden, N.J. Metropolitan Division (MD); the Montgomery County-Bucks County-Chester County, Pa. Metropolitan Division (MD); the Philadelphia, Pa. Metropolitan Division (MD); and the Wilmington, Del.-Md.-N.J. Metropolitan Division (MD).
The Camden, NJ MD consists of Burlington, Camden, and Gloucester Counties in New Jersey.
The Montgomery County-Bucks County-Chester County, PA MD consists of Bucks, Chester, and Montgomery Counties in Pennsylvania.
The Philadelphia, PA MD consists of Delaware and Philadelphia Counties in Pennsylvania.
The Wilmington, DE-MD-NJ MD consists of New Castle County in Delaware, Cecil County in Maryland, and Salem County in New Jersey.
Information in this release is available to sensory-impaired individuals. Voice phone: (202) 691-5200; Federal Relay Service: (800) 877-8339.
| Metropolitan Areas (1) | Total fatalities | Transportation incidents | Contact with objects and equipment | Exposure to harmful substances or environments | Violence and other injuries by persons or animals | Falls, slips, trips |
|---|---|---|---|---|---|---|
United States (2) | 5,250 | 2,080 | 786 | 621 | 828 | 791 |
New York-Newark-Jersey City, NY-NJ-PA | 209 | 53 | 33 | 32 | 32 | 50 |
Los Angeles-Long Beach-Anaheim, CA | 122 | 38 | 15 | 10 | 25 | 34 |
Chicago-Naperville-Elgin, IL-IN-WI | 107 | 24 | 22 | 14 | 25 | 19 |
Houston-The Woodlands-Sugar Land, TX | 100 | 28 | 13 | 13 | 29 | 16 |
Dallas-Fort Worth-Arlington, TX | 89 | 33 | 10 | 8 | 17 | 15 |
Atlanta-Sandy Springs-Roswell, GA | 82 | 33 | 11 | 5 | 19 | 13 |
Miami-Fort Lauderdale-West Palm Beach, FL | 70 | 21 | 12 | 14 | 8 | 14 |
Washington-Arlington-Alexandria, DC-VA-MD-WV | 68 | 18 | 6 | 14 | 14 | 12 |
Philadelphia-Camden-Wilmington, PA-NJ-DE-MD | 63 | 21 | 17 | 10 | 8 | 5 |
Boston-Cambridge-Newton, MA-NH | 60 | 11 | 11 | 11 | 11 | 15 |
Footnotes: | ||||||
NOTE: Data for all years are final. Totals for major categories may include subcategories not shown separately. Percentages may not add to totals because of rounding. CFOI fatal injury counts exclude illness-related deaths unless precipitated by an injury event. Dashes indicate no data reported or data that do not meet publication criteria. | ||||||
| Event or exposure (1) | 2017 | 2018 | |
|---|---|---|---|
| Number | Number | Percent | |
Total | 45 | 63 | 100 |
Violence and other injuries by persons or animals | 9 | 8 | 13 |
Intentional injury by person | 9 | 8 | 13 |
Homicides | 8 | 5 | 8 |
Shooting by other person—intentional | 7 | 2 | 3 |
Stabbing, cutting, slashing, piercing | - | 1 | 2 |
Multiple violent acts by other person | 1 | 1 | 2 |
Suicides | - | 3 | 5 |
Transportation incidents | 12 | 21 | 33 |
Aircraft incidents | 2 | 2 | 3 |
Aircraft crash during takeoff or landing | 2 | 2 | 3 |
Aircraft crash during takeoff or landing—into structure, object, or ground | 2 | 2 | 3 |
Animal and other non-motorized vehicle transportation incidents | - | 2 | 3 |
Animal transportation incident | - | 1 | 2 |
Thrown, fell, or jumped from animal being ridden | - | 1 | 2 |
Pedal cycle incident | - | 1 | 2 |
Pedal cycle collision in roadway | - | 1 | 2 |
Pedestrian vehicular incident | 3 | 5 | 8 |
Pedestrian struck by vehicle in roadway | - | 1 | 2 |
Pedestrian struck by forward-moving vehicle in roadway | - | 1 | 2 |
Pedestrian struck by vehicle on side of road | 1 | 1 | 2 |
Pedestrian struck by forward-moving vehicle on side of road | 1 | 1 | 2 |
Pedestrian struck by vehicle in nonroadway area | 1 | 3 | 5 |
Roadway incident involving motorized land vehicle | 7 | 11 | 17 |
Roadway collision with other vehicle | 4 | 3 | 5 |
Roadway collision moving and standing vehicle in roadway | 1 | 1 | 2 |
Roadway collision moving and standing vehicle on side of roadway | - | 1 | 2 |
Roadway collision with object other than vehicle | 3 | 8 | 13 |
Vehicle struck object or animal on side of roadway | - | 8 | 13 |
Fire or explosion | - | 2 | 3 |
Fire | - | 1 | 2 |
Collapsing building, structure, or structural element during fire | - | 1 | 2 |
Explosion | - | 1 | 2 |
Explosion of nonpressurized vapors, gases, or liquids | - | 1 | 2 |
Falls, slips, trips | 7 | 5 | 8 |
Fall to lower level | 6 | 4 | 6 |
Other fall to lower level | 4 | 3 | 5 |
Other fall to lower level more than 30 feet | - | 1 | 2 |
Exposure to harmful substances or environments | 7 | 10 | 16 |
Exposure to electricity | 4 | - | - |
Direct exposure to electricity | 3 | 1 | 2 |
Direct exposure to electricity, 220 volts or less | 1 | 1 | 2 |
Exposure to other harmful substances | 3 | 6 | 10 |
Nonmedical use of drugs or alcohol unintentional overdose | 3 | 5 | 8 |
Contact with objects and equipment | 9 | 17 | 27 |
Struck by object or equipment | 8 | 13 | 21 |
Struck by powered vehicle nontransport | 3 | 6 | 10 |
Caught between rolling powered vehicle and other object | - | 1 | 2 |
Struck or run over by rolling powered vehicle | - | 1 | 2 |
Struck by swinging part of powered vehicle | - | 1 | 2 |
Struck by other falling powered vehicle | - | 3 | 5 |
Struck by falling object or equipment | 5 | 5 | 8 |
Struck by discharged or flying object | - | 1 | 2 |
Struck by dislodged flying object, particle | - | 1 | 2 |
Struck, caught, or crushed in collapsing structure, equipment, or material | - | 3 | 5 |
Excavation or trenching cave-in | - | 1 | 2 |
Footnotes: | |||
NOTE: Data for all years are final. Totals for major categories may include subcategories not shown separately. Percentages may not add to totals because of rounding. CFOI fatal injury counts exclude illness-related deaths unless precipitated by an injury event. Dashes indicate no data reported or data that do not meet publication criteria. | |||
| Industry (1) | 2017 | 2018 | |
|---|---|---|---|
| Number | Number | Percent | |
Total | 45 | 63 | 100 |
Private industry | 40 | 62 | 98 |
Goods-producing | 14 | 16 | 25 |
Natural resources and mining | - | 1 | 2 |
Agriculture, forestry, fishing and hunting | - | 1 | 2 |
Animal production and aquaculture | - | 1 | 2 |
Cattle ranching and farming | - | 1 | 2 |
Dairy cattle and milk production | - | 1 | 2 |
Construction | 10 | 13 | 21 |
Specialty trade contractors | 7 | 12 | 19 |
Foundation, structure, and building exterior contractors | 3 | 4 | 6 |
Building equipment contractors | - | 3 | 5 |
Electrical contractors and other wiring installation contractors | - | 1 | 2 |
Plumbing, heating, and air-conditioning contractors | - | 2 | 3 |
Other specialty trade contractors | 1 | 4 | 6 |
Site preparation contractors | 1 | 4 | 6 |
Nonresidential site preparation contractors | - | 1 | 2 |
Manufacturing | 2 | - | - |
Nonmetallic mineral product manufacturing | - | 1 | 2 |
Other nonmetallic mineral product manufacturing | - | 1 | 2 |
All other nonmetallic mineral product manufacturing | - | 1 | 2 |
Cut stone and stone product manufacturing | - | 1 | 2 |
Service providing | 26 | 46 | 73 |
Trade, transportation, and utilities | 15 | 22 | 35 |
Retail trade | 3 | 5 | 8 |
Motor vehicle and parts dealers | - | - | - |
Automotive parts, accessories, and tire stores | - | - | - |
Tire dealers | - | 1 | 2 |
Transportation and warehousing | 9 | 16 | 25 |
Air transportation | 1 | 2 | 3 |
Nonscheduled air transportation | 1 | 2 | 3 |
Nonscheduled air transportation | 1 | 2 | 3 |
Nonscheduled chartered passenger air transportation | - | 2 | 3 |
Truck transportation | 1 | 8 | 13 |
General freight trucking | - | 6 | 10 |
General freight trucking, long-distance | - | 5 | 8 |
General freight trucking, long-distance, truckload | - | 3 | 5 |
General freight trucking, long-distance, less than truckload | - | 1 | 2 |
Support activities for transportation | 3 | 1 | 2 |
Support activities for road transportation | 2 | 1 | 2 |
Motor vehicle towing | 2 | 1 | 2 |
Couriers and messengers | - | 1 | 2 |
Local messengers and local delivery | - | 1 | 2 |
Local messengers and local delivery | - | 1 | 2 |
Professional and business services | 4 | 14 | 22 |
Professional, scientific, and technical services | - | 1 | 2 |
Professional, scientific, and technical services | - | 1 | 2 |
Scientific research and development services | - | 1 | 2 |
Research and development in the physical, engineering, and life sciences | - | 1 | 2 |
Research and development in biotechnology | - | 1 | 2 |
Administrative and support and waste management and remediation services | 4 | 13 | 21 |
Administrative and support services | 3 | 11 | 17 |
Investigation and security services | - | - | - |
Security systems services | - | 1 | 2 |
Security systems services (except locksmiths) | - | 1 | 2 |
Services to buildings and dwellings | - | 8 | 13 |
Janitorial services | - | 1 | 2 |
Landscaping services | - | 7 | 11 |
Leisure and hospitality | 2 | 2 | 3 |
Arts, entertainment, and recreation | - | 1 | 2 |
Performing arts, spectator sports, and related industries | - | 1 | 2 |
Spectator sports | - | 1 | 2 |
Spectator sports | - | 1 | 2 |
Accommodation and food services | 2 | 1 | 2 |
Food services and drinking places | 2 | 1 | 2 |
Drinking places (alcoholic beverages) | 2 | 1 | 2 |
Drinking places (alcoholic beverages) | 2 | 1 | 2 |
Other services, except public administration | - | 4 | 6 |
Repair and maintenance | - | 3 | 5 |
Automotive repair and maintenance | - | 3 | 5 |
Automotive mechanical and electrical repair and maintenance | - | 2 | 3 |
General automotive repair | - | 2 | 3 |
Religious, grantmaking, civic, professional, and similar organizations | - | 1 | 2 |
Business, professional, labor, political, and similar organizations | - | 1 | 2 |
Labor unions and similar labor organizations | - | 1 | 2 |
Government(2) | 5 | 1 | 2 |
Local government | - | 1 | 2 |
Service providing | - | 1 | 2 |
Public administration | - | 1 | 2 |
Justice, public order, and safety activities | - | 1 | 2 |
Justice, public order, and safety activities | - | 1 | 2 |
Fire protection | - | 1 | 2 |
Footnotes: (2) Includes fatal injuries to workers employed by governmental organizations regardless of industry. | |||
NOTE: Data for all years are final. Totals for major categories may include subcategories not shown separately. Percentages may not add to totals because of rounding. CFOI fatal injury counts exclude illness-related deaths unless precipitated by an injury event. Dashes indicate no data reported or data that do not meet publication criteria. | |||
| Occupation (1) | 2017 | 2018 | |
|---|---|---|---|
| Number | Number | Percent | |
Total | 45 | 63 | 100 |
Management, business, science, and arts occupations | 3 | 4 | 6 |
Management, business, and financial occupations | 3 | - | - |
Management occupations | 3 | - | - |
Other management occupations | - | 1 | 2 |
Agricultural managers | - | 1 | 2 |
Farmers, ranchers, and other agricultural managers | - | 1 | 2 |
Professional and related occupations | - | 2 | 3 |
Computer, engineering, and science occupations | - | 1 | 2 |
Life, physical, and social science occupations | - | 1 | 2 |
Physical scientists | - | 1 | 2 |
Chemists and materials scientists | - | 1 | 2 |
Chemists | - | 1 | 2 |
Education, legal, community service, arts, and media occupations | - | 1 | 2 |
Arts, design, entertainment, sports, and media occupations | - | 1 | 2 |
Entertainers and performers, sports and related workers | - | 1 | 2 |
Athletes, coaches, umpires, and related workers | - | 1 | 2 |
Athletes and sports competitors | - | 1 | 2 |
Service occupations | 8 | 11 | 17 |
Protective service occupations | 3 | - | - |
First-line supervisors/managers, protective service workers | 1 | 1 | 2 |
First-line supervisors of fire fighting and prevention workers | - | 1 | 2 |
First-line supervisors of fire fighting and prevention workers | - | 1 | 2 |
Food preparation and serving related occupations | 2 | 1 | 2 |
Food and beverage serving workers | - | 1 | 2 |
Bartenders | - | 1 | 2 |
Bartenders | - | 1 | 2 |
Building and grounds cleaning and maintenance occupations | 3 | 7 | 11 |
Supervisors, building and grounds cleaning and maintenance workers | 1 | 3 | 5 |
First-line supervisors/managers, building and grounds cleaning and maintenance workers | 1 | 3 | 5 |
First-line supervisors of landscaping, lawn service, and groundskeeping workers | - | 3 | 5 |
Grounds maintenance workers | - | 4 | 6 |
Grounds maintenance workers | - | 4 | 6 |
Tree trimmers and pruners | - | 3 | 5 |
Sales and office occupations | 3 | 4 | 6 |
Office and administrative support occupations | - | - | - |
Material recording, scheduling, dispatching, and distributing workers | - | - | - |
Dispatchers | - | 1 | 2 |
Dispatchers, except police, fire, and ambulance | - | 1 | 2 |
Natural resources, construction, and maintenance occupations | 15 | 19 | 30 |
Construction and extraction occupations | 10 | 14 | 22 |
Supervisors of construction and extraction workers | - | 3 | 5 |
First-line supervisors/managers of construction trades and extraction workers | - | 3 | 5 |
First-line supervisors of construction trades and extraction workers | - | 3 | 5 |
Construction trades workers | 8 | 11 | 17 |
Construction laborers | 2 | 8 | 13 |
Construction laborers | 2 | 8 | 13 |
Electricians | - | 1 | 2 |
Electricians | - | 1 | 2 |
Pipelayers, plumbers, pipefitters, and steamfitters | - | 2 | 3 |
Plumbers, pipefitters, and steamfitters | - | 2 | 3 |
Installation, maintenance, and repair occupations | 5 | 5 | 8 |
Vehicle and mobile equipment mechanics, installers, and repairers | - | 5 | 8 |
Automotive technicians and repairers | - | 3 | 5 |
Automotive service technicians and mechanics | - | 2 | 3 |
Miscellaneous vehicle and mobile equipment mechanics, installers, and repairers | - | 1 | 2 |
Tire repairers and changers | - | 1 | 2 |
Production, transportation, and material moving occupations | 16 | 25 | 40 |
Transportation and material moving occupations | 14 | 25 | 40 |
Air transportation workers | 2 | 2 | 3 |
Aircraft pilots and flight engineers | 2 | 2 | 3 |
Commercial pilots | 2 | 2 | 3 |
Motor vehicle operators | 7 | 15 | 24 |
Driver/sales workers and truck drivers | 5 | 14 | 22 |
Heavy and tractor-trailer truck drivers | 4 | 12 | 19 |
Material moving workers | 3 | 6 | 10 |
Laborers and material movers, hand | 3 | 4 | 6 |
Cleaners of vehicles and equipment | - | 1 | 2 |
Laborers and freight, stock, and material movers, hand | 3 | 3 | 5 |
Footnotes: | |||
NOTE: Data for all years are final. Totals for major categories may include subcategories not shown separately. Percentages may not add to totals because of rounding. CFOI fatal injury counts exclude illness-related deaths unless precipitated by an injury event. Dashes indicate no data reported or data that do not meet publication criteria. | |||
| Worker characteristics | 2017 | 2018 | |
|---|---|---|---|
| Number | Number | Percent | |
Total | 45 | 63 | 100 |
Employee status | |||
Wage and salary workers (1) | 38 | 48 | 76 |
Self-employed (2) | 7 | 15 | 24 |
Gender | |||
Men | 44 | 58 | 92 |
Women | 1 | 5 | 8 |
Age (3) | |||
20 to 24 years | - | 4 | 6 |
25 to 34 years | 9 | 16 | 25 |
35 to 44 years | 8 | 9 | 14 |
45 to 54 years | 14 | 14 | 22 |
55 to 64 years | 10 | 13 | 21 |
65 and over | 4 | 6 | 10 |
Race or ethnic origin (4) | |||
White (non-Hispanic) | 29 | 32 | 51 |
Black or African-American (non-Hispanic) | 12 | 15 | 24 |
Hispanic or Latino | - | 12 | 19 |
Asian (non-Hispanic) | - | 4 | 6 |
Footnotes: | |||
NOTE: Data for all years are final. Totals for major categories may include subcategories not shown separately. Percentages may not add to totals because of rounding. CFOI fatal injury counts exclude illness-related deaths unless precipitated by an injury event. Dashes indicate no data reported or data that do not meet publication criteria. | |||
Last Modified Date: Thursday, June 04, 2020