An official website of the United States government
An official website of the United States government
The .gov means it's official.
Federal government websites often end in .gov or .mil. Before sharing sensitive information,
make sure you're on a federal government site.
The site is secure.
The
https:// ensures that you are connecting to the official website and that any
information you provide is encrypted and transmitted securely.
25-1006-PHI
Wednesday, June 11, 2025
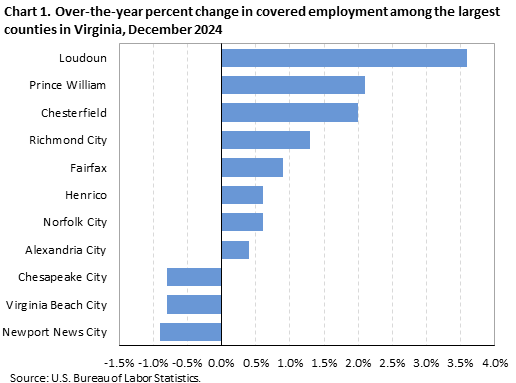
Among the 11 counties with published data, employment rose in 8 of the largest counties in Virginia from December 2023 to December 2024, the U.S. Bureau of Labor Statistics reported today. Regional Commissioner Alexandra Hall Bovee noted that Loudoun County had the largest over-the-year increase in employment at 3.6 percent. (See chart 1 and table 1.)
Among the 12 largest counties in Virginia, employment was highest in Fairfax (642,000) in December 2024. Together, the 12 largest counties accounted for 55.3 percent of total covered employment within the state. Nationwide, the 369 largest counties comprise 73.3 percent of total covered employment in the United States. (Large counties and county equivalents are those with annual average employment levels of 75,000 or more in 2023.)
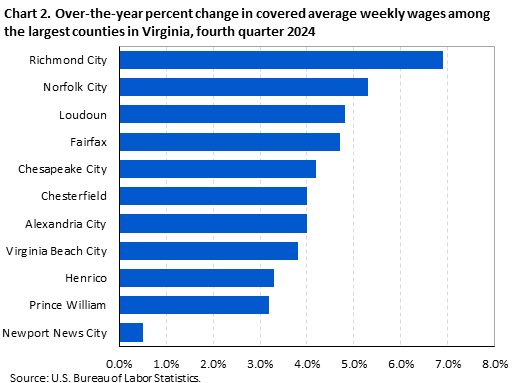
Large county average weekly wages in the fourth quarter 2024All 11 large Virginia counties with published data reported average weekly wage gains over the year. (See chart 2.) Richmond City had the largest gain (+6.9 percent). Over-the-year wage gains among Virginia’s other ten large counties ranged from 5.3 percent to 0.5 percent.
Weekly wages in 5 of the 12 largest counties in Virginia were above the national average of $1,507. Average weekly wages ranged from $2,468 in Arlington to $1,152 in Virginia Beach City.
Smaller county average weekly wages in the fourth quarter of 2024Employment and wage levels (but not over-the-year changes) are also available for the 121 small counties in Virginia, defined as having employment below 75,000 in 2023. (See table 2.) Wage levels in 114 of the 121 smaller counties were below the national average. Goochland reported the highest average weekly wage ($2,172). Grayson reported the lowest average weekly wage ($767) in the state.
Among all 133 Virginia counties, 31 reported average weekly wages of $949 or less, 45 registered wages from $950 to $1,099, 26 had wages from $1,100 to $1,249, and 31 had average weekly wages of $1,250 or higher. (See map 1. and table 2.)
QCEW data for states have been included in this release in table 3.
Nationwide coverage of the largest counties is published in the County Employment and Wages news release. Additional information about quarterly employment and wages data is available in the news release Technical Note and from the Quarterly Census of Employment and Wages website.
Information in this release will be made available to individuals with sensory impairments upon request. Voice phone: (202) 691-5200; Telecommunications Relay Service: 7-1-1.
The County Employment and Wages release for the first quarter 2025 is scheduled to be released on Tuesday, September 9, 2025.
The Quarterly Census of Employment and Wages (QCEW) is streamlining its release process. Beginning with the fourth quarter 2024 national release on June 4, QCEW will publish the national County Employment and Wages news release on the same date as the QCEW full data update. Revised news release dates are available online.
| Area | Establishments, fourth quarter (thousands) | Employment | Average weekly wage (1) | |||||
|---|---|---|---|---|---|---|---|---|
| December 2024 (thousands) | Percent change, December 2023–24 (2) | National ranking by percent change (3) | Fourth quarter 2024 ($) | National ranking by level (3) | Percent change, fourth quarter 2023–24 (2) | National ranking by percent change (3) | ||
United States (4) | 12,265.4 | 156,202.9 | 0.8 | -- | 1,507 | -- | 5.0 | -- |
Virginia | 320.9 | 4,142.6 | 1.2 | -- | 1,546 | 11 | 4.3 | 26 |
Arlington | 9.7 | 182.3 | (5) | - | 2,468 | 9 | (5) | - |
Chesterfield | 10.4 | 149.8 | 2.0 | 25 | 1,258 | 234 | 4.0 | 203 |
Fairfax | 39.4 | 642.0 | 0.9 | 120 | 2,258 | 10 | 4.7 | 140 |
Henrico | 12.8 | 189.0 | 0.6 | 177 | 1,385 | 156 | 3.3 | 269 |
Loudoun | 14.9 | 202.9 | 3.6 | 2 | 1,716 | 39 | 4.8 | 130 |
Prince William | 10.8 | 145.0 | 2.1 | 21 | 1,288 | 213 | 3.2 | 276 |
Alexandria City | 6.5 | 81.7 | 0.4 | 206 | 1,879 | 20 | 4.0 | 203 |
Chesapeake City | 7.0 | 105.3 | -0.8 | 334 | 1,187 | 298 | 4.2 | 184 |
Newport News City | 4.6 | 102.4 | -0.9 | 340 | 1,339 | 176 | 0.5 | 354 |
Norfolk City | 6.5 | 145.4 | 0.6 | 177 | 1,416 | 131 | 5.3 | 89 |
Richmond City | 9.3 | 166.5 | 1.3 | 69 | 1,665 | 47 | 6.9 | 25 |
Virginia Beach City | 13.9 | 177.0 | -0.8 | 334 | 1,152 | 321 | 3.8 | 225 |
Footnotes: | ||||||||
Note: Data are preliminary. Dashes indicate data not applicable or available. Covered employment and wages include workers covered by Unemployment Insurance (UI) and Unemployment Compensation for Federal Employees (UCFE) programs. | ||||||||
| Area | Establishments | Employment December 2024 | Average weekly wage ($) (1) |
|---|---|---|---|
United States (2) | 12,265,395 | 156,202,874 | 1,507 |
Virginia | 320,884 | 4,142,634 | 1,546 |
Accomack | 1,241 | 12,958 | 1,049 |
Albemarle | 4,196 | 65,918 | 1,530 |
Alleghany | 485 | 3,263 | 888 |
Amelia | 405 | 2,502 | 970 |
Amherst | 800 | 8,181 | 957 |
Appomattox | 530 | 3,594 | 842 |
Arlington | 9,698 | 182,318 | 2,468 |
Augusta | 2,032 | 30,157 | 1,172 |
Bath | 246 | 2,353 | 1,230 |
Bedford | 2,320 | 18,707 | 973 |
Bland | 144 | 1,993 | 1,292 |
Botetourt | 988 | 11,782 | 1,242 |
Brunswick | 502 | 3,363 | 1,012 |
Buchanan | 553 | 6,139 | 1,266 |
Buckingham | 489 | 3,147 | 992 |
Campbell | 1,798 | 18,474 | 1,161 |
Caroline | 749 | 6,967 | 952 |
Carroll | 661 | 5,854 | 816 |
Charles City | 238 | 1,890 | 1,232 |
Charlotte | 496 | 2,781 | 931 |
Chesterfield | 10,390 | 149,761 | 1,258 |
Clarke | 488 | 3,949 | 1,114 |
Craig | 146 | 734 | 1,008 |
Culpeper | 1,591 | 16,356 | 1,162 |
Cumberland | 259 | 1,425 | 960 |
Dickenson | 323 | 3,310 | 1,106 |
Dinwiddie | 568 | 10,438 | 1,307 |
Essex | 406 | 3,508 | 932 |
Fairfax | 39,359 | 642,038 | 2,258 |
Fauquier | 2,626 | 23,896 | 1,322 |
Floyd | 531 | 3,821 | 849 |
Fluvanna | 672 | 4,773 | 1,162 |
Franklin | 1,621 | 15,682 | 954 |
Frederick | 2,173 | 39,657 | 1,226 |
Giles | 453 | 5,134 | 1,061 |
Gloucester | 1,107 | 10,084 | 948 |
Goochland | 1,049 | 18,799 | 2,172 |
Grayson | 357 | 3,368 | 767 |
Greene | 546 | 3,975 | 876 |
Greensville | 245 | 3,500 | 1,239 |
Halifax | 1,016 | 11,866 | 1,033 |
Hanover | 4,354 | 59,111 | 1,151 |
Henrico | 12,761 | 188,951 | 1,385 |
Henry | 1,722 | 15,550 | 899 |
Highland | 129 | 591 | 912 |
Isle of Wight | 935 | 10,013 | 1,137 |
James City | 2,295 | 30,400 | 1,055 |
King and Queen | 214 | 1,132 | 1,121 |
King George | 693 | 13,873 | 1,725 |
King William | 500 | 4,239 | 1,188 |
Lancaster | 539 | 4,714 | 1,065 |
Lee | 523 | 4,233 | 895 |
Loudoun | 14,936 | 202,869 | 1,716 |
Louisa | 1,120 | 10,135 | 1,193 |
Lunenburg | 355 | 2,393 | 966 |
Madison | 472 | 3,044 | 1,031 |
Mathews | 256 | 1,545 | 852 |
Mecklenburg | 1,050 | 11,933 | 1,022 |
Middlesex | 404 | 3,316 | 939 |
Montgomery | 2,645 | 44,389 | 1,224 |
Nelson | 549 | 4,055 | 976 |
New Kent | 588 | 6,267 | 1,076 |
Northampton | 591 | 4,338 | 895 |
Northumberland | 387 | 2,330 | 1,162 |
Nottoway | 475 | 5,461 | 1,021 |
Orange | 1,040 | 9,594 | 960 |
Page | 617 | 5,393 | 870 |
Patrick | 481 | 4,067 | 818 |
Pittsylvania | 1,427 | 13,224 | 976 |
Powhatan | 895 | 8,341 | 1,149 |
Prince Edward | 718 | 8,711 | 954 |
Prince George | 678 | 14,990 | 1,273 |
Prince William | 10,834 | 145,042 | 1,288 |
Pulaski | 889 | 15,389 | 1,056 |
Rappahannock | 293 | 1,486 | 982 |
Richmond | 290 | 2,737 | 939 |
Roanoke | 2,694 | 37,622 | 1,099 |
Rockbridge | 566 | 6,067 | 891 |
Rockingham | 2,084 | 34,797 | 1,109 |
Russell | 569 | 6,045 | 989 |
Scott | 408 | 5,006 | 893 |
Shenandoah | 1,149 | 13,298 | 992 |
Smyth | 806 | 11,493 | 974 |
Southampton | 350 | 3,604 | 968 |
Spotsylvania | 3,607 | 38,786 | 1,070 |
Stafford | 3,313 | 47,316 | 1,310 |
Surry | 145 | 2,183 | 1,905 |
Sussex | 299 | 3,171 | 1,073 |
Tazewell | 1,001 | 13,732 | 879 |
Warren | 1,187 | 13,355 | 1,042 |
Washington | 1,606 | 20,655 | 963 |
Westmoreland | 489 | 3,177 | 920 |
Wise | 794 | 11,241 | 930 |
Wythe | 927 | 11,699 | 922 |
York | 1,737 | 22,317 | 1,062 |
Alexandria City | 6,482 | 81,691 | 1,879 |
Bristol City | 617 | 10,799 | 954 |
Buena Vista City | 199 | 2,548 | 1,012 |
Charlottesville City | 2,613 | 36,955 | 1,573 |
Chesapeake City | 6,956 | 105,286 | 1,187 |
Colonial Heights City | 761 | 9,825 | 869 |
Covington City | 292 | 3,689 | 1,121 |
Danville City | 1,827 | 25,724 | 968 |
Emporia City | 266 | 3,369 | 807 |
Fairfax City | 1,816 | 24,899 | 1,430 |
Falls Church City | 1,060 | 12,341 | 1,673 |
Franklin City | 323 | 3,935 | 807 |
Fredericksburg City | 1,768 | 24,990 | 1,241 |
Galax City | 401 | 5,690 | 809 |
Hampton City | 3,144 | 51,011 | 1,233 |
Harrisonburg City | 1,765 | 31,316 | 1,016 |
Hopewell City | 550 | 7,262 | 1,397 |
Lexington City | 309 | 5,591 | 948 |
Lynchburg City | 2,682 | 48,030 | 1,170 |
Manassas City | 1,607 | 24,632 | 1,737 |
Manassas Park City | 347 | 3,665 | 1,375 |
Martinsville City | 963 | 9,410 | 846 |
Newport News City | 4,556 | 102,390 | 1,339 |
Norfolk City | 6,500 | 145,405 | 1,416 |
Norton City | 230 | 3,058 | 897 |
Petersburg City | 997 | 11,631 | 1,063 |
Poquoson City | 254 | 1,869 | 987 |
Portsmouth City | 1,890 | 43,253 | 1,306 |
Radford City | 370 | 6,352 | 974 |
Richmond City | 9,340 | 166,539 | 1,665 |
Roanoke City | 3,561 | 67,456 | 1,267 |
Salem City | 1,128 | 20,519 | 1,254 |
Staunton City | 934 | 11,535 | 966 |
Suffolk City | 2,227 | 37,104 | 1,276 |
Virginia Beach City | 13,936 | 176,951 | 1,152 |
Waynesboro City | 778 | 9,595 | 981 |
Williamsburg City | 574 | 11,999 | 1,062 |
Winchester City | 1,491 | 25,451 | 1,255 |
Footnotes: | |||
Note: Data are preliminary. Dashes indicate data not applicable or available. Covered employment and wages include workers covered by Unemployment Insurance (UI) and Unemployment Compensation for Federal Employees (UCFE) programs. | |||
| State | Establishments, fourth quarter (thousands) | Employment | Average weekly wage (1) | ||||
|---|---|---|---|---|---|---|---|
| December 2024 (thousands) | Percent change, December 2023–24 | Fourth quarter 2024 ($) | National ranking by level | Percent change, fourth quarter 2023–24 | National ranking by percent change | ||
United States (2) | 12,265.4 | 156,202.9 | 0.8 | 1,507 | -- | 5.0 | -- |
Alabama | 162.3 | 2,122.2 | 0.9 | 1,255 | 36 | 4.1 | 32 |
Alaska | 25.3 | 317.4 | 1.7 | 1,430 | 16 | 4.2 | 30 |
Arizona | 225.5 | 3,272.3 | 1.2 | 1,406 | 19 | 6.4 | 6 |
Arkansas | 106.1 | 1,312.6 | 1.1 | 1,153 | 50 | 5.9 | 10 |
California | 1,903.9 | 18,230.8 | 0.5 | 1,872 | 5 | 6.5 | 5 |
Colorado | 236.6 | 2,911.3 | -0.3 | 1,594 | 8 | 5.1 | 16 |
Connecticut | 150.7 | 1,700.7 | 0.5 | 1,716 | 6 | 5.2 | 15 |
Delaware | 45.2 | 480.6 | 1.5 | 1,437 | 15 | 4.5 | 24 |
District of Columbia | 52.4 | 757.2 | -0.5 | 2,495 | 1 | 4.7 | 21 |
Florida | 914.8 | 9,978.9 | 0.9 | 1,405 | 20 | 5.7 | 13 |
Georgia | 396.6 | 4,916.6 | 0.8 | 1,391 | 21 | 4.7 | 21 |
Hawaii | 61.4 | 651.3 | 1.1 | 1,345 | 27 | 4.3 | 26 |
Idaho | 103.9 | 859.1 | 0.5 | 1,232 | 39 | 8.3 | 3 |
Illinois | 411.2 | 6,089.1 | 0.5 | 1,538 | 12 | 4.1 | 32 |
Indiana | 194.6 | 3,201.9 | 0.4 | 1,222 | 44 | 4.4 | 25 |
Iowa | 112.5 | 1,559.3 | -0.6 | 1,237 | 38 | 3.2 | 50 |
Kansas | 103.5 | 1,445.6 | 0.9 | 1,218 | 45 | 4.3 | 26 |
Kentucky | 159.0 | 2,008.4 | 0.2 | 1,189 | 46 | 3.8 | 39 |
Louisiana | 156.8 | 1,936.3 | 1.1 | 1,228 | 40 | 2.8 | 51 |
Maine | 66.2 | 643.9 | 0.9 | 1,278 | 33 | 5.9 | 10 |
Maryland | 197.0 | 2,779.9 | 1.6 | 1,570 | 10 | 4.2 | 30 |
Massachusetts | 288.5 | 3,646.1 | -0.4 | 1,890 | 3 | 4.7 | 21 |
Michigan | 303.4 | 4,406.8 | -0.1 | 1,370 | 23 | 4.1 | 32 |
Minnesota | 215.1 | 2,945.4 | 1.1 | 1,452 | 14 | 3.7 | 42 |
Mississippi | 90.9 | 1,174.3 | 0.2 | 1,023 | 51 | 4.1 | 32 |
Missouri | 251.5 | 2,922.2 | 0.5 | 1,268 | 35 | 3.8 | 39 |
Montana | 65.8 | 512.8 | 0.5 | 1,254 | 37 | 6.4 | 6 |
Nebraska | 78.0 | 1,024.8 | 0.5 | 1,227 | 41 | 3.5 | 45 |
Nevada | 108.1 | 1,561.5 | 0.4 | 1,350 | 25 | 6.1 | 9 |
New Hampshire | 68.7 | 692.4 | 0.4 | 1,577 | 9 | 3.3 | 49 |
New Jersey | 339.1 | 4,332.2 | 0.9 | 1,629 | 7 | 3.4 | 47 |
New Mexico | 68.9 | 873.8 | 0.3 | 1,223 | 42 | 5.0 | 17 |
New York | 711.5 | 9,777.3 | 1.5 | 1,881 | 4 | 5.4 | 14 |
North Carolina | 384.0 | 4,941.9 | 0.5 | 1,358 | 24 | 5.8 | 12 |
North Dakota | 36.9 | 431.1 | 0.9 | 1,315 | 30 | 3.8 | 39 |
Ohio | 346.3 | 5,551.7 | 0.6 | 1,305 | 32 | 4.8 | 20 |
Oklahoma | 129.7 | 1,713.2 | 0.8 | 1,168 | 48 | 4.1 | 32 |
Oregon | 190.9 | 1,989.6 | 0.0 | 1,424 | 17 | 6.6 | 4 |
Pennsylvania | 395.1 | 6,076.5 | 0.8 | 1,414 | 18 | 4.0 | 37 |
Rhode Island | 48.9 | 500.8 | 1.6 | 1,348 | 26 | 3.5 | 45 |
South Carolina | 195.3 | 2,310.1 | 1.4 | 1,223 | 42 | 6.2 | 8 |
South Dakota | 40.6 | 459.7 | 0.9 | 1,181 | 47 | 3.9 | 38 |
Tennessee | 232.2 | 3,320.3 | 0.9 | 1,372 | 22 | 5.0 | 17 |
Texas | 846.0 | 14,129.7 | 1.5 | 1,488 | 13 | 4.3 | 26 |
Utah | 142.6 | 1,735.8 | 1.3 | 1,333 | 29 | 3.7 | 42 |
Vermont | 33.7 | 311.2 | 0.0 | 1,311 | 31 | 4.9 | 19 |
Virginia | 320.9 | 4,142.6 | 1.2 | 1,546 | 11 | 4.3 | 26 |
Washington | 241.5 | 3,612.0 | 0.8 | 1,897 | 2 | 8.7 | 2 |
West Virginia | 62.7 | 701.4 | 0.2 | 1,159 | 49 | 3.4 | 47 |
Wisconsin | 212.2 | 2,950.8 | 0.4 | 1,278 | 33 | 3.6 | 44 |
Wyoming | 31.1 | 279.4 | 0.5 | 1,340 | 28 | 12.4 | 1 |
Puerto Rico | 51.6 | 975.4 | -0.2 | 718 | (3) | 4.5 | (3) |
Virgin Islands | 3.0 | 33.1 | -8.6 | 1,046 | (3) | 1.8 | (3) |
Footnotes: | |||||||
Note: Data are preliminary. Dashes indicate data not applicable or available. Covered employment and wages include workers covered by Unemployment Insurance (UI) and Unemployment Compensation for Federal Employees (UCFE) programs. | |||||||
Last Modified Date: Wednesday, June 11, 2025