
An official website of the United States government
An official website of the United States government
The .gov means it's official.
Federal government websites often end in .gov or .mil. Before sharing sensitive information,
make sure you're on a federal government site.
The site is secure.
The
https:// ensures that you are connecting to the official website and that any
information you provide is encrypted and transmitted securely.
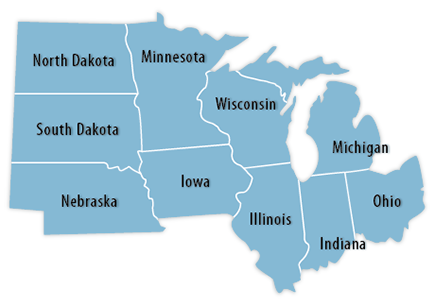
Click a state from the map or pick a state from the list:
Illinois | Indiana | Iowa | Michigan | Minnesota | Nebraska | North Dakota | Ohio | South Dakota | Wisconsin
 Economic Summaries:
Economic Summaries are specialized products that combine data graphically from subjects such as unemployment, inflation, and wages into a single document for selected metropolitan areas. To view a specific area in this region, use the dropdown list below or click here.
The Consumer Price Index for All Urban Consumers (CPI-U) in the Chicago-Naperville-Elgin area fell 0.9 percent in June.
The Consumer Price Index for All Urban Consumers (CPI-U) in the Detroit-Warren-Dearborn area advanced 0.7 percent for the two months ending in June 2026.
The Consumer Price Index for All Urban Consumers (CPI-U) for the Midwest region fell 0.5 percent in June.
The Consumer Price Index for All Urban Consumers (CPI-U) for St. Louis, MO-IL was up 0.5 percent from April to June.
Workers in the Kokomo, IN Metropolitan Statistical Area had an average (mean) hourly wage of $28.60 in May 2025, compared to the nationwide average of $33.54.