An official website of the United States government
An official website of the United States government
The .gov means it's official.
Federal government websites often end in .gov or .mil. Before sharing sensitive information,
make sure you're on a federal government site.
The site is secure.
The
https:// ensures that you are connecting to the official website and that any
information you provide is encrypted and transmitted securely.
16-2217-CHI
Wednesday, December 28, 2016
Over 22,000 nonfatal workplace injuries and illnesses were reported among Nebraska’s private industry employers in 2015, resulting in an incidence rate of 3.4 cases per 100 equivalent full-time workers, the U.S. Bureau of Labor Statistics reported today. (See table A.) Assistant Commissioner for Regional Operations Charlene Peiffer noted that Nebraska was among 21 states that had an incidence rate of total recordable cases (TRC) significantly higher than the national rate of 3.0. (Nebraska was 1 of 41 states and the District of Columbia for which statewide estimates are available. See Technical Note at the end of this release for more information about the survey.)
Nebraska’s findings from the 2015 Survey of Occupational Injuries and Illnesses include:
| Characteristic | United States | Nebraska | ||
|---|---|---|---|---|
| Number (in thousands) | Rate (per 100 workers) | Number (in thousands) | Rate (per 100 workers) | |
Total cases | 2,905.9 | 3.0 | 22.5 | 3.4 |
Cases with days away from work, job transfer, or restriction | 1,571.9 | 1.6 | 11.8 | 1.8 |
Cases with days away from work | 902.2 | 0.9 | 6.4 | 1.0 |
Cases with job transfer or restriction | 669.8 | 0.7 | 5.3 | 0.8 |
Other recordable cases | 1,333.9 | 1.4 | 10.7 | 1.6 |
Of the 22,500 private industry injury and illness cases reported in Nebraska, 11,800 were of a more severe nature, involving days away from work, job transfer, or restriction—commonly referred to as DART cases. These cases occurred at a rate of 1.8 cases per 100 full-time workers. Fifty-four percent of the DART cases in Nebraska were incidents that resulted in at least one day away from work, compared to 57 percent nationally. Other recordable cases (those not involving days away from work, job transfer, or restriction) accounted for the remaining 10,700 cases in Nebraska, at a rate of 1.6. In comparison, the national rate for other recordable cases was 1.4.
In Nebraska, the manufacturing supersector had a significant decline in the TRC incidence rate and in the DART incidence rate over the year. The education and health services supersector had a significant increase in the TRC incidence rate from the previous year. No other supersector had a significant change in either the TRC incidence rate or the DART incidence rate from the previous year.
In 2015, approximately 20,100 (89 percent) of private industry recordable injuries and illnesses were injuries. Workplace illnesses accounted for an additional 2,300 recordable cases. Three categories—hearing loss, skin disorders, and respiratory conditions—accounted for almost 35 percent of the occupational illnesses in Nebraska. Nationally, these three categories amounted to 36 percent of the work-related illness total.
State and local government injury and illness casesAmong the state and local government sector in Nebraska, 3,800 injury and illness cases were reported in 2015, resulting in a rate of 3.3 cases per 100 full-time workers. Nationally, the rate was 5.1. Approximately 79 percent of injuries and illnesses reported in Nebraska’s public sector occurred among local government workers.
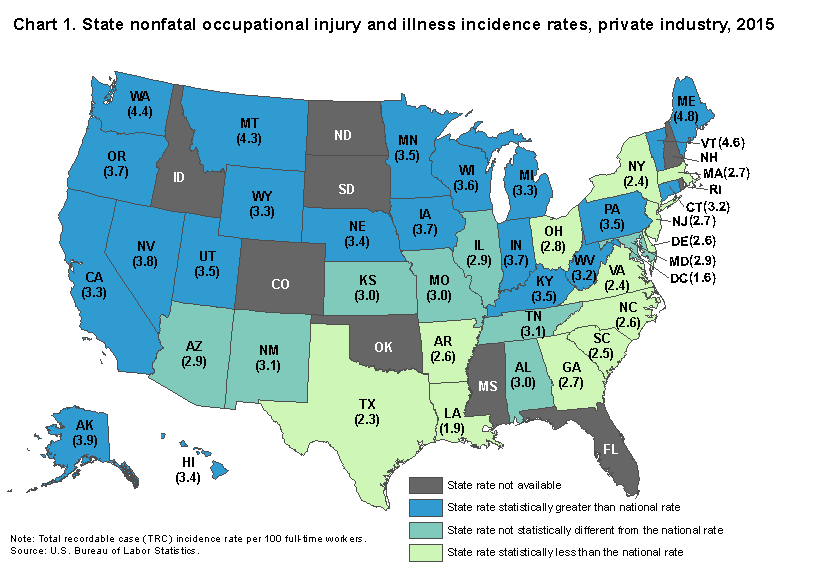
State estimates and over-the-year changeFor 2015, occupational injury and illness data are available for 41 states and the District of Columbia. Twenty-one states, including Nebraska, had private industry TRC incidence rates higher than the national rate of 3.0 cases per 100 full-time workers in 2015. (See chart 1.) Twelve states and the District of Columbia had TRC rates lower than the national rate. Eight states had TRC rates that were about the same as the national rate. Factors such as differences in the composition of industry employment may influence state incidence rates and should be considered when comparing rates among different states.
Compared to 2014, private industry TRC incidence rates declined in nine states. The private industry TRC incidence rate was relatively unchanged in 32 states, including Nebraska, and in the District of Columbia. Estimates for nine states were not available in 2015 for comparison.
The Survey of Occupational Injuries and Illnesses (SOII) is a Federal/State program in which employer's reports are collected annually from approximately 200,000 private industry and public sector (State and local government) establishments and processed by State agencies in cooperation with the Bureau of Labor Statistics. Summary information on the number of injuries and illnesses is transcribed by these employers directly from their recordkeeping logs to the survey questionnaire. The questionnaire also asks for the number of employee hours worked (needed in the calculation of incidence rates) as well as its annual average employment (needed to verify the unit's employment-size class).
Occupational injury and illness data for establishments in coal, metal, and nonmetal mining industries and for railroad activities are provided by the Department of Labor's Mine Safety and Health Administration (MSHA) and the Department of Transportation's Federal Railroad Administration (FRA), respectively. The SOII excludes all work-related fatalities as well as nonfatal work injuries and illnesses to the self-employed; to workers on farms with 10 or fewer employees; to private household workers; to volunteers; and to federal government workers.
Injuries and illnesses logged by employers conform to definitions and recordkeeping guidelines set by the Occupational Safety and Health Administration (OSHA), U.S. Department of Labor. Under OSHA guidelines, nonfatal cases are recordable if they are occupational injuries or illnesses which involve lost worktime, medical treatment other than first aid, restriction of work or motion, loss of consciousness, or transfer to another job. Employers record injuries separate from illnesses and also identify for each whether a case involved any days away from work or days of restricted work activity, or both, beyond the day of injury or onset of illness.
Survey estimates are based on a scientifically selected sample of establishments, some of which represent only themselves, but most of which also represent other employers of like industry and workforce size that were not chosen to report data in a given survey year.
The incidence rates presented in this release represent the number of injuries and/or illnesses per 100 full-time equivalent workers and were calculated as:
(N / EH) X 200,000 where,
N = number of injuries and/or illnesses
EH = total hours worked by all employees during the calendar year
200,000 = base for 100 full-time equivalent workers (working 40 hours per week, 50 weeks per year)
Background and methodological information regarding the BLS occupational safety and health statistics program can be found in Chapter 9 of the BLS Handbook of Methods at www.bls.gov/opub/hom/pdf/homch9.pdf.
Additional occupational injury and illness data are available from our regional web page at www.bls.gov/regions/midwest/. Information in this release will be made available to sensory impaired individuals upon request. Voice phone: (202)-691-5200; Federal Relay Service: (800)-877-8339.
| Industry(1)(2)(3) | Total recordable cases | Cases with days away from work, job transfer, or restriction | Other recordable cases | ||
|---|---|---|---|---|---|
| Total | Cases with days away from work(4) | Cases with job transfer or restriction | |||
All industries including state and local government | 3.4 | 1.7 | 1.0 | 0.7 | 1.7 |
Private industry | 3.4 | 1.8 | 1.0 | 0.8 | 1.6 |
Goods-producing | 5.2 | 3.0 | 1.3 | 1.6 | 2.3 |
Natural resources and mining | 5.7 | 4.2 | 3.5 | 0.7 | 1.6 |
Construction | 3.9 | 1.8 | 1.3 | 0.5 | 2.1 |
Manufacturing | 5.8 | 3.4 | 1.1 | 2.2 | 2.4 |
Service-providing | 2.9 | 1.4 | 0.9 | 0.6 | 1.4 |
Trade, transportation, and utilities | 3.6 | 2.0 | 1.2 | 0.8 | 1.5 |
Information | 0.7 | 0.3 | 0.2 | (5) | 0.4 |
Financial activities | 0.8 | 0.3 | 0.2 | 0.1 | 0.5 |
Professional and business services | 1.3 | 0.6 | 0.5 | 0.2 | 0.7 |
Education and health services | 4.9 | 2.2 | 1.4 | 0.9 | 2.6 |
Leisure and hospitality | 2.8 | 1.1 | 0.7 | 0.3 | 1.7 |
Other services, except public administration | 2.7 | 1.4 | 0.6 | - | 1.3 |
State and local government | 3.3 | 1.1 | 0.9 | 0.2 | 2.3 |
State government | - | - | - | - | - |
Local government | 3.7 | 1.1 | 0.9 | 0.2 | 2.5 |
Footnotes: | |||||
Note: Dashes indicate data not available. | |||||
| Industry(1)(2)(3) | Total recordable cases | Cases with days away from work, job transfer, or restriction | Other recordable cases | ||
|---|---|---|---|---|---|
| Total | Cases with days away from work(4) | Cases with job transfer or restriction | |||
All industries including state and local government | 26.3 | 13.0 | 7.4 | 5.6 | 13.3 |
Private industry | 22.5 | 11.8 | 6.4 | 5.3 | 10.7 |
Goods-producing | 8.1 | 4.6 | 2.1 | 2.6 | 3.5 |
Natural resources and mining | 0.6 | 0.4 | 0.4 | 0.1 | 0.2 |
Construction | 1.7 | 0.8 | 0.6 | 0.2 | 0.9 |
Manufacturing | 5.8 | 3.4 | 1.1 | 2.3 | 2.4 |
Service-providing | 14.3 | 7.2 | 4.4 | 2.8 | 7.2 |
Trade, transportation, and utilities | 5.9 | 3.3 | 2.0 | 1.4 | 2.5 |
Information | 0.1 | (5) | (5) | (5) | 0.1 |
Financial activities | 0.5 | 0.2 | 0.1 | 0.1 | 0.3 |
Professional and business services | 1.2 | 0.6 | 0.4 | 0.2 | 0.6 |
Education and health services | 4.8 | 2.2 | 1.4 | 0.9 | 2.6 |
Leisure and hospitality | 1.4 | 0.5 | 0.4 | 0.2 | 0.9 |
Other services, except public administration | 0.5 | 0.3 | 0.1 | - | 0.3 |
State and local government | 3.8 | 1.2 | 1.0 | 0.3 | 2.6 |
State government | - | - | - | - | - |
Local government | 3.0 | 0.9 | 0.8 | 0.1 | 2.1 |
Footnotes: | |||||
Note: Dashes indicate data not available. | |||||
| Industry(1)(2)(3) | All establishments | Establishment employment size (workers) | ||||
|---|---|---|---|---|---|---|
| 1 to 10 | 11 to 49 | 50 to 249 | 250 to 999 | 1,000 or more | ||
All industries including state and local government | 3.4 | 1.4 | 3.3 | 4.0 | 3.2 | 4.7 |
Private industry | 3.4 | 1.3 | 3.3 | 3.9 | 3.3 | 5.5 |
Goods-producing | 5.2 | 2.1 | 4.8 | 5.1 | 4.0 | 10.0 |
Natural resources and mining | 5.7 | (4) | 6.8 | 4.1 | - | - |
Construction | 3.9 | - | 4.5 | 4.4 | 1.7 | - |
Manufacturing | 5.8 | - | 4.2 | 5.5 | 4.1 | 10.0 |
Service-providing | 2.9 | 1.2 | 2.9 | 3.6 | 3.0 | 3.6 |
Trade, transportation, and utilities | 3.6 | 1.4 | 3.8 | 4.1 | 5.0 | - |
Information | 0.7 | (4) | - | - | 0.8 | - |
Financial activities | 0.8 | (4) | 1.0 | 1.3 | 1.2 | 0.6 |
Professional and business services | 1.3 | - | 1.6 | 1.9 | 1.0 | 0.6 |
Education and health services | 4.9 | - | 4.0 | 5.3 | 6.9 | 5.9 |
Leisure and hospitality | 2.8 | - | 2.4 | 3.8 | 4.0 | - |
Other services, except public administration | 2.7 | - | - | 3.9 | - | - |
State and local government | 3.3 | - | 3.5 | 4.5 | - | 2.6 |
State government | - | - | - | - | - | - |
Local government | 3.7 | - | 3.6 | 4.5 | - | - |
Footnotes: | ||||||
Note: Dashes indicate data not available. | ||||||
| Industry(1)(2)(3) | Total recordable cases | Cases with days away from work, job transfer, or restriction (4) | ||
|---|---|---|---|---|
| 2014 | 2015 | 2014 | 2015 | |
All industries including state and local government | 3.6 | 3.4 | 1.7 | 1.7 |
Private industry | 3.5 | 3.4 | 1.8 | 1.8 |
Goods-producing | 5.6 | 5.2 | 3.1 | 3.0 |
Natural resources and mining | 5.3 | 5.7 | 3.1 | 4.2 |
Construction | 4.0 | 3.9 | 1.6 | 1.8 |
Manufacturing | 6.3 | 5.8* | 3.8 | 3.4* |
Service-providing | 2.9 | 2.9 | 1.4 | 1.4 |
Trade, transportation, and utilities | 3.6 | 3.6 | 2.0 | 2.0 |
Information | - | 0.7 | - | 0.3 |
Financial activities | - | 0.8 | - | 0.3 |
Professional and business services | 1.1 | 1.3 | 0.4 | 0.6 |
Education and health services | 4.1 | 4.9* | 1.8 | 2.2 |
Leisure and hospitality | 3.4 | 2.8 | 1.0 | 1.1 |
Other services, except public administration | 2.3 | 2.7 | 1.1 | 1.4 |
State and local government | - | 3.3 | - | 1.1 |
State government | - | - | - | - |
Local government | 4.0 | 3.7 | 1.1 | 1.1 |
Footnotes: | ||||
Note: Dashes indicate data not available. | ||||
Last Modified Date: Wednesday, December 28, 2016