An official website of the United States government
An official website of the United States government
The .gov means it's official.
Federal government websites often end in .gov or .mil. Before sharing sensitive information,
make sure you're on a federal government site.
The site is secure.
The
https:// ensures that you are connecting to the official website and that any
information you provide is encrypted and transmitted securely.
17-1605-CHI
Thursday, February 22, 2018
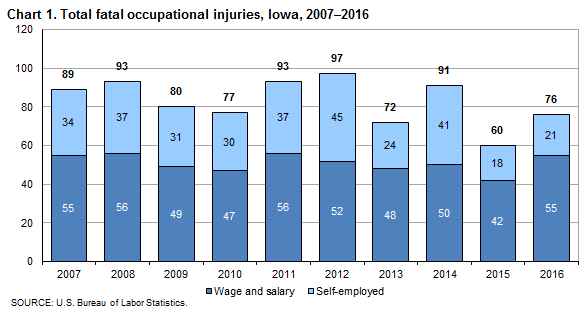
Fatal work injuries totaled 76 in 2016 for Iowa, the U.S. Bureau of Labor Statistics reported today. Assistant Commissioner for Regional Operations Charlene Peiffer noted that the number of work-related fatalities in Iowa increased from 60 in the previous year. Fatal occupational injuries in the state have ranged from a high of 110 in 1992 to a low of 54 in 1995. (See chart 1.)
Nationwide, a total of 5,190 fatal work injuries were recorded in 2016, a 7-percent increase from the 4,836 fatal injuries in 2015, according to the results from the Census of Fatal Occupational Injuries (CFOI) program. This was the third consecutive increase in annual workplace fatalities and the first time more than 5,000 fatalities have been recorded since 2008.
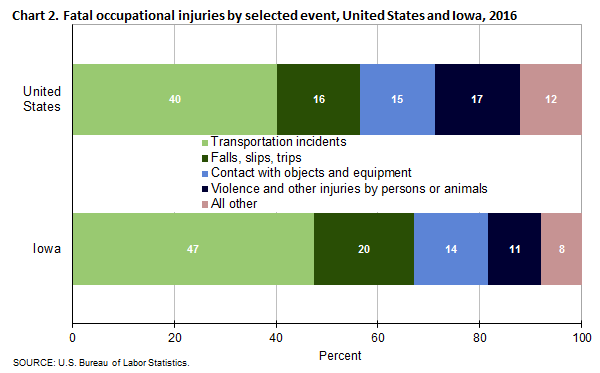
Type of incidentIn Iowa, transportation incidents resulted in 36 fatal work injuries. Falls, slips, or trips and contact with objects or equipment accounted for 15 and 11 fatal work injuries, respectively. These three major categories accounted for 82 percent of all workplace fatalities in the state. (See table 1.) The number of worker deaths from transportation incidents was up from 19 the previous year. Fatalities from falls, slips, or trips were little changed from the previous year, while fatalities from contact with objects or equipment were down by six.
Nationally, transportation incidents were the most frequent fatal workplace event in 2016, accounting for 40 percent of fatal work injuries. (See chart 2.) Violence and other injuries by persons or animals was the second-most common fatal event (17 percent), followed by falls, slips, or trips (16 percent).
IndustryThe private agriculture, forestry, fishing, and hunting industry sector had the largest number of fatalities in Iowa with 19, up from 16 the previous year. (See table 2.) Transportation incidents was the most frequent fatal event in the agriculture sector with 13 worker deaths. Fifty-three percent of those fatally injured in this sector worked in crop production.
The private construction sector had 13 workplace fatalities, little changed from the previous year. Specialty trade contractors accounted for 7, or 54 percent, of the fatal injuries in this industry.
OccupationTransportation and material moving occupations had the highest number of workplace fatalities with 24. Over half of the fatalities within this group were heavy and tractor-trailer truck drivers (13). Management occupations and construction and extraction occupations had 12 and 11 fatalities, respectively. (See table 3.) Almost all of the fatalities within the management group were farmers, ranchers, and other agricultural managers (11). Construction laborers accounted for 4 of the 11 fatalities among construction and extraction workers.
Additional highlightsBackground of the program. The Census of Fatal Occupational Injuries (CFOI), part of the BLS Occupational Safety and Health Statistics (OSHS) program, compiles a count of all fatal work injuries occurring in the U.S. during the calendar year. The CFOI program uses diverse state, federal, and independent data sources to identify, verify, and describe fatal work injuries. This ensures counts are as complete and accurate as possible. For the national 2016 data, over 23,300 unique source documents were reviewed as part of the data collection process. For technical information and definitions for CFOI, please go to the BLS Handbook of Methods on the BLS website at www.bls.gov/opub/hom/cfoi/home.htm.
Federal/State agency coverage. The CFOI includes data for all fatal work injuries, even those that may be outside the scope of other agencies or regulatory coverage. Thus, any comparison between the BLS fatality census counts and those released by other agencies should take into account the different coverage requirements and definitions being used by each agency. More on the scope of CFOI can be found at www.bls.gov/iif/cfoiscope.htm.
Acknowledgments. BLS thanks the Iowa Workforce Development for their efforts in collecting accurate, comprehensive, and useful data on fatal work injuries. BLS also appreciates the efforts of all federal, state, local, and private sector entities that provided source documents used to identify fatal work injuries. Among these agencies are the Occupational Safety and Health Administration; the National Transportation Safety Board; the U.S. Coast Guard; the Mine Safety and Health Administration; the Office of Workers’ Compensation Programs (Federal Employees' Compensation and Longshore and Harbor Workers' Compensation divisions); the Federal Railroad Administration; the National Highway Traffic Safety Administration; state vital statistics registrars, coroners, and medical examiners; state departments of health, labor, and industrial relations and workers' compensation agencies; state and local police departments; and state farm bureaus.
| Event or exposure (1) | 2015 | 2016 | |
|---|---|---|---|
| Number | Number | Percent | |
Total | 60 | 76 | 100 |
Violence and other injuries by persons or animals | 1 | 8 | 11 |
Intentional injury by person | 1 | 4 | 5 |
Injury by person--unintentional or intent unknown | -- | 1 | 1 |
Self-inflicted injury--unintentional or intent unknown | -- | 1 | 1 |
Self-inflicted shooting--unintentional | -- | 1 | 1 |
Animal and insect related incidents | -- | 3 | 4 |
Transportation incidents | 19 | 36 | 47 |
Aircraft incidents | 1 | 4 | 5 |
Rail vehicle incidents | -- | 1 | 1 |
Pedestrian struck by rail vehicle--transportation incident | -- | 1 | 1 |
Pedestrian vehicular incident | -- | 4 | 5 |
Pedestrian struck by vehicle in nonroadway area | -- | -- | -- |
Pedestrian struck by forward-moving vehicle in nonroadway area | -- | 1 | 1 |
Roadway incidents involving motorized land vehicle | 12 | 22 | 29 |
Roadway collision with other vehicle | 8 | 12 | 16 |
Roadway collision--moving in same direction | -- | 3 | 4 |
Roadway collision--moving in opposite directions, oncoming | 3 | 4 | 5 |
Roadway collision with object other than vehicle | -- | 4 | 5 |
Vehicle struck object or animal on side of roadway | -- | 3 | 4 |
Roadway noncollision incident | 3 | 6 | 8 |
Jack-knifed or overturned, roadway | -- | 5 | 7 |
Ran off roadway | 1 | 1 | 1 |
Nonroadway incident involving motorized land vehicles | 6 | 5 | 7 |
Nonroadway noncollision incident | 5 | 4 | 5 |
Jack-knifed or overturned, nonroadway | 5 | 3 | 4 |
Falls, slips, trips | 16 | 15 | 20 |
Falls on same level | 7 | 3 | 4 |
Falls to lower level | 9 | 12 | 16 |
Other fall to lower level | 7 | 11 | 14 |
Other fall to lower level 11 to 15 feet | 1 | 1 | 1 |
Other fall to lower level 16 to 20 feet | -- | 1 | 1 |
Other fall to lower level more than 30 feet | -- | 3 | 4 |
Exposure to harmful substances or environments | -- | 4 | 5 |
Exposure to other harmful substances | 2 | 3 | 4 |
Contact with objects and equipment | 17 | 11 | 14 |
Struck by object or equipment | 8 | 8 | 11 |
Struck by powered vehicle--nontransport | 5 | 5 | 7 |
Struck by falling object or equipment--other than powered vehicle | -- | 3 | 4 |
Footnotes: | |||
NOTE: Data for all years are final. Totals for major categories may include subcategories not shown separately. Percentages may not add to totals because of rounding. CFOI fatality counts exclude illness-related deaths unless precipitated by an injury event. Dashes indicate no data reported or data that do not meet publication criteria. | |||
| Industry (1) | 2015 | 2016 | |
|---|---|---|---|
| Number | Number | Percent | |
Total | 60 | 76 | 100 |
Private industry | 57 | 69 | 91 |
Natural resources and mining | 16 | 20 | 26 |
Agriculture, forestry, fishing and hunting | 16 | 19 | 25 |
Crop production | 5 | 10 | 13 |
Oilseed and grain farming | 2 | 5 | 7 |
Corn farming | 2 | 4 | 5 |
Animal production and aquaculture | 10 | 6 | 8 |
Cattle ranching and farming | 7 | 5 | 7 |
Beef cattle ranching and farming, including feedlots | -- | 2 | 3 |
Cattle feedlots | -- | 2 | 3 |
Hog and pig farming | 2 | 1 | 1 |
Construction | 12 | 13 | 17 |
Construction | 12 | 13 | 17 |
Construction of buildings | -- | 2 | 3 |
Residential building construction | -- | 1 | 1 |
Residential building construction | -- | 1 | 1 |
Residential remodelers | -- | 1 | 1 |
Nonresidential building construction | -- | 1 | 1 |
Commercial and institutional building construction | -- | 1 | 1 |
Heavy and civil engineering construction | 1 | 3 | 4 |
Specialty trade contractors | 10 | 7 | 9 |
Foundation, structure, and building exterior contractors | 7 | 4 | 5 |
Structural steel and precast concrete contractors | -- | 1 | 1 |
Nonresidential structural steel and precast concrete contractors | -- | 1 | 1 |
Masonry contractors | -- | 1 | 1 |
Roofing contractors | 2 | 1 | 1 |
Building finishing contractors | -- | 1 | 1 |
Painting and wall covering contractors | -- | 1 | 1 |
Other specialty trade contractors | -- | 2 | 3 |
Site preparation contractors | -- | 2 | 3 |
Nonresidential site preparation contractors | -- | 1 | 1 |
Manufacturing | 5 | 5 | 7 |
Manufacturing | 5 | 5 | 7 |
Food manufacturing | -- | 4 | 5 |
Grain and oilseed milling | -- | 1 | 1 |
Starch and vegetable fats and oils manufacturing | -- | 1 | 1 |
Wet corn milling | -- | 1 | 1 |
Fruit and vegetable preserving and specialty food manufacturing | -- | 1 | 1 |
Fruit and vegetable canning, pickling, and drying | -- | 1 | 1 |
Dried and dehydrated food manufacturing | -- | 1 | 1 |
Bakeries and tortilla manufacturing | -- | 1 | 1 |
Cookie, cracker, and pasta manufacturing | -- | 1 | 1 |
Cookie and cracker manufacturing | -- | 1 | 1 |
Nonmetallic mineral product manufacturing | -- | 1 | 1 |
Cement and concrete product manufacturing | -- | 1 | 1 |
Ready-mix concrete manufacturing | -- | 1 | 1 |
Trade, transportation, and utilities | 14 | 19 | 25 |
Wholesale trade | 5 | 5 | 7 |
Merchant wholesalers, durable goods | 1 | -- | -- |
Motor vehicle and motor vehicle parts and supplies merchant wholesalers | -- | 1 | 1 |
Tire and tube merchant wholesalers | -- | 1 | 1 |
Merchant wholesalers, nondurable goods | 4 | 3 | 4 |
Petroleum and petroleum products merchant wholesalers | -- | 1 | 1 |
Petroleum bulk stations and terminals | -- | 1 | 1 |
Retail trade | 4 | 3 | 4 |
Motor vehicle and parts dealers | -- | -- | -- |
Other motor vehicle dealers | -- | 1 | 1 |
Motorcycle, boat, and other motor vehicle dealers | -- | 1 | 1 |
General merchandise stores | -- | 1 | 1 |
Other general merchandise stores | -- | 1 | 1 |
Warehouse clubs and supercenters | -- | 1 | 1 |
Transportation and warehousing | 5 | 10 | 13 |
Truck transportation | 3 | 9 | 12 |
General freight trucking | -- | 5 | 7 |
General freight trucking, long-distance | -- | 4 | 5 |
General freight trucking, long-distance, less than truckload | -- | 3 | 4 |
Specialized freight trucking | 1 | 4 | 5 |
Specialized freight (except used goods) trucking, local | -- | 1 | 1 |
Professional and business services | 5 | 4 | 5 |
Administrative and waste services | 4 | 4 | 5 |
Administrative and support services | 4 | 1 | 1 |
Services to buildings and dwellings | 3 | 1 | 1 |
Landscaping services | 3 | 1 | 1 |
Waste management and remediation services | -- | 3 | 4 |
Waste collection | -- | 3 | 4 |
Waste collection | -- | 3 | 4 |
Solid waste collection | -- | 3 | 4 |
Educational and health services | -- | 4 | 5 |
Health care and social assistance | -- | 4 | 5 |
Hospitals | -- | 1 | 1 |
General medical and surgical hospitals | -- | 1 | 1 |
Nursing and residential care facilities | -- | -- | -- |
Continuing care retirement communities and assisted living facilities for the elderly | -- | 1 | 1 |
Continuing care retirement communities and assisted living facilities for the elderly | -- | 1 | 1 |
Assisted living facilities for the elderly | -- | 1 | 1 |
Social assistance | -- | 1 | 1 |
Individual and family services | -- | 1 | 1 |
Other services, except public administration | 3 | 2 | 3 |
Other services, except public administration | 3 | 2 | 3 |
Repair and maintenance | 2 | 1 | 1 |
Commercial machinery repair and maintenance | -- | 1 | 1 |
Religious, grantmaking, civic, professional, and similar organizations | 1 | 1 | 1 |
Business, professional, labor, political, and similar organizations | -- | 1 | 1 |
Political organizations | -- | 1 | 1 |
Government (2) | 3 | 7 | 9 |
Local government | 1 | 6 | 8 |
Footnotes: | |||
NOTE: Data for all years are final. Totals for major categories may include subcategories not shown separately. Percentages may not add to totals because of rounding. CFOI fatality counts exclude illness-related deaths unless precipitated by an injury event. Dashes indicate no data reported or data that do not meet publication criteria. | |||
| Occupation (1) | 2015 | 2016 | |
|---|---|---|---|
| Number | Number | Percent | |
Total | 60 | 76 | 100 |
Management occupations | 14 | 12 | 16 |
Other management occupations | 14 | 12 | 16 |
Farmers, ranchers, and other agricultural managers | 14 | 11 | 14 |
Farmers, ranchers, and other agricultural managers | 14 | 11 | 14 |
Construction managers | -- | 1 | 1 |
Construction managers | -- | 1 | 1 |
Healthcare support occupations | -- | 3 | 4 |
Nursing, psychiatric, and home health aides | -- | 3 | 4 |
Nursing, psychiatric, and home health aides | -- | 3 | 4 |
Protective service occupations | -- | 7 | 9 |
Law enforcement workers | -- | 5 | 7 |
Police officers | -- | 5 | 7 |
Police and sheriff's patrol officers | -- | 5 | 7 |
Building and grounds cleaning and maintenance occupations | 5 | -- | -- |
Supervisors of building and grounds cleaning and maintenance workers | 1 | 1 | 1 |
First-line supervisors of building and grounds cleaning and maintenance workers | 1 | 1 | 1 |
First-line supervisors of landscaping, lawn service, and groundskeeping workers | -- | 1 | 1 |
Sales and related occupations | 3 | 3 | 4 |
Office and administrative support occupations | -- | 1 | 1 |
Information and record clerks | 1 | 1 | 1 |
Miscellaneous information and record clerks | -- | 1 | 1 |
Farming, fishing, and forestry occupations | 3 | 5 | 7 |
Agricultural workers | 3 | 5 | 7 |
Miscellaneous agricultural workers | 3 | 5 | 7 |
Farmworkers and laborers, crop, nursery, and greenhouse | 3 | 1 | 1 |
Farmworkers, farm, ranch, and aquacultural animals | -- | 4 | 5 |
Construction and extraction occupations | 10 | 11 | 14 |
Supervisors of construction and extraction workers | -- | 1 | 1 |
First-line supervisors of construction trades and extraction workers | -- | 1 | 1 |
First-line supervisors of construction trades and extraction workers | -- | 1 | 1 |
Construction trades workers | 10 | 9 | 12 |
Brickmasons, blockmasons, and stonemasons | -- | 1 | 1 |
Brickmasons and blockmasons | -- | 1 | 1 |
Construction laborers | 5 | 4 | 5 |
Construction laborers | 5 | 4 | 5 |
Pipelayers, plumbers, pipefitters, and steamfitters | -- | 1 | 1 |
Pipelayers | -- | 1 | 1 |
Roofers | 2 | 1 | 1 |
Roofers | 2 | 1 | 1 |
Installation, maintenance, and repair occupations | 7 | 4 | 5 |
Electrical and electronic equipment mechanics, installers, and repairers | -- | 1 | 1 |
Miscellaneous electrical and electronic equipment mechanics, installers, and repairers | -- | 1 | 1 |
Electrical and electronics repairers, commercial and industrial equipment | -- | 1 | 1 |
Transportation and material moving occupations | 9 | 24 | 32 |
Motor vehicle operators | 7 | 17 | 22 |
Driver/sales workers and truck drivers | 7 | 17 | 22 |
Heavy and tractor-trailer truck drivers | 7 | 13 | 17 |
Material moving workers | 2 | 4 | 5 |
Laborers and material movers, hand | 1 | 1 | 1 |
Laborers and freight, stock, and material movers, hand | 1 | 1 | 1 |
Footnotes: | |||
NOTE: Totals for major categories may include subcategories not shown separately. Percentages may not add to totals because of rounding. CFOI fatality counts exclude illness-related deaths unless precipitated by an injury event. Dashes indicate no data reported or data that do not meet publication criteria. | |||
| Worker characteristics | 2015 | 2016 | |
|---|---|---|---|
| Number | Number | Percent | |
Total | 60 | 76 | 100 |
Employee status | |||
Wage and salary workers (1) | 42 | 55 | 72 |
Self-employed (2) | 18 | 21 | 28 |
Gender | |||
Men | 58 | 69 | 91 |
Women | -- | 7 | 9 |
Age (3) | |||
20 to 24 years | -- | 5 | 7 |
25 to 34 years | 11 | 12 | 16 |
35 to 44 years | 8 | 13 | 17 |
45 to 54 years | 9 | 12 | 16 |
55 to 64 years | 15 | 16 | 21 |
65 years and over | 15 | 17 | 22 |
Race or ethnic origin (4) | |||
White, non-Hispanic | 54 | 65 | 86 |
Black or African-American, non-Hispanic | 3 | 4 | 5 |
Hispanic or Latino | -- | 4 | 5 |
Footnotes: | |||
NOTE: Data for all years are final. Totals for major categories may include subcategories not shown separately. Percentages may not add to totals because of rounding. CFOI fatality counts exclude illness-related deaths unless precipitated by an injury event. Dashes indicate no data reported or data that do not meet publication criteria. | |||
Last Modified Date: Thursday, February 22, 2018