An official website of the United States government
An official website of the United States government
The .gov means it's official.
Federal government websites often end in .gov or .mil. Before sharing sensitive information,
make sure you're on a federal government site.
The site is secure.
The
https:// ensures that you are connecting to the official website and that any
information you provide is encrypted and transmitted securely.
19-2184-CHI
Tuesday, February 25, 2020
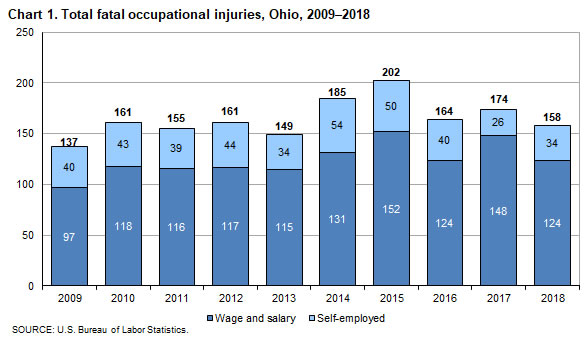
Fatal work injuries totaled 158 in 2018 for Ohio, the U.S. Bureau of Labor Statistics reported today. Assistant Commissioner for Regional Operations Charlene Peiffer noted that the number of work-related fatalities in Ohio was down 16 from the previous year. (See chart 1.) Fatal occupational injuries in the state have ranged from a high of 222 in 1999 to a low of 137 in 2009.
Nationwide, a total of 5,250 fatal work injuries were recorded in 2018, up from the 5,147 fatal injuries in 2017, according to the results from the Census of Fatal Occupational Injuries (CFOI) program.
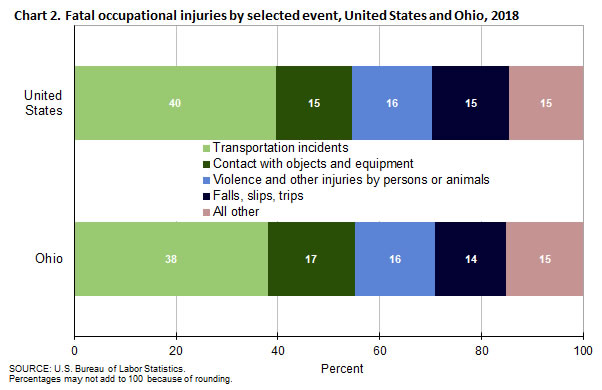
Type of incidentIn Ohio, transportation incidents resulted in 60 fatal work injuries in 2018, up from 52 in 2017. Contact with objects and equipment accounted for 27 fatalities and violence and other injuries by persons or animals resulted in 25 fatalities. These three major categories accounted for 71 percent of all workplace fatalities in the state in 2018. (See table 1.) Worker deaths from contact with objects and equipment were up from 24 over the year, and worker fatalities due to violence and other injuries by persons or animals were down from 32 in the previous year.
Two categories—falls, slips, and trips and exposure to harmful substances or environments—each accounted for an additional 22 worker fatalities in Ohio.
Nationally, transportation incidents were the most frequent fatal workplace event in 2018, accounting for 40 percent of fatal work injuries. (See chart 2.) Violence and other injuries by persons or animals was the second-most frequent type of event (16 percent), followed by falls, slips, and trips (15 percent), and contact with objects and equipment (15 percent).
IndustryThe private transportation and warehousing industry had the highest number of fatalities in Ohio with 30, down from 36 in the previous year. (See table 2.) Transportation incidents resulted in 18 of the 30 fatalities in the industry. The private construction industry had 29 workplace fatalities in 2018, down from 32 in 2017. The specialty trade contractors sector accounted for 18 of the 29 workplace fatalities in the construction industry.
OccupationThe transportation and material moving occupational group had the highest number of workplace fatalities with 55. (See table 3.) Heavy and tractor-trailer truck drivers suffered 30 of the work-related deaths within the transportation and material moving group. The construction and extraction occupational group had the second highest number of workplace fatalities with 28, followed by building and grounds cleaning and maintenance occupations with 15. Construction trades workers accounted for 21 of the 28 fatalities within the construction and extraction group. Grounds maintenance workers accounted for 8 of the 15 building and grounds cleaning and maintenance occupations fatalities.
Additional highlightsMen accounted for 92 percent of the work-related fatalities in Ohio, matching the national share. (See table 4.) Transportation incidents made up 37 percent of the fatalities for men in Ohio.
White non-Hispanics accounted for 76 percent of those who died from a workplace injury. Nationwide, this group accounted for 65 percent of work-related deaths.
Workers 25-54 years old accounted for 58 percent of the state’s work-related fatalities in 2018, matching the national share.
Of the 158 fatally-injured workers in Ohio, 78 percent worked for wages and salaries; the remainder were self-employed. The most frequent fatal event for both wage and salary workers and self-employed workers was transportation incidents.
Background of the program. The Census of Fatal Occupational Injuries (CFOI), part of the Bureau of Labor Statistics (BLS) Occupational Safety and Health Statistics (OSHS) program, is a count of all fatal work injuries occurring in the U.S. during the calendar year. The CFOI uses a variety of state, federal, and independent data sources to identify, verify, and describe fatal work injuries. This ensures counts are as complete and accurate as possible. For the 2018 national data, over 24,800 unique source documents were reviewed as part of the data collection process. For technical information and definitions for the CFOI, see the BLS Handbook of Methods on the BLS website at www.bls.gov/opub/hom/cfoi/home.htm.
Federal/State agency coverage. The CFOI includes data for all fatal work injuries, some of which may be outside the scope of other agencies or regulatory coverage. Comparisons between CFOI counts and those released by other agencies should account for the different coverage requirements and definitions used by each agency. For more information on the scope of CFOI, see www.bls.gov/iif/cfoiscope.htm and www.bls.gov/opub/hom/cfoi/concepts.htm.
Acknowledgments. BLS thanks the Ohio BWC Division of Safety and Hygiene for their efforts in collecting accurate, comprehensive, and useful data on fatal work injuries. BLS also appreciates the efforts of all federal, state, local, and private sector entities that provided source documents used to identify fatal work injuries. Among these agencies are the Occupational Safety and Health Administration; the National Transportation Safety Board; the U.S. Coast Guard; the Mine Safety and Health Administration; the Office of Workers’ Compensation Programs (Federal Employees' Compensation and Longshore and Harbor Workers' Compensation divisions); the Federal Railroad Administration; the National Highway Traffic Safety Administration; state vital statistics registrars, coroners, and medical examiners; state departments of health, labor, and industrial relations and workers' compensation agencies; state and local police departments; and state farm bureaus.
Information in this release will be made available to sensory impaired individuals upon request. Voice phone: (202) 691-5200; Federal Relay Service: (800) 877-8339.
| Event or exposure (1) | 2017 | 2018 | |
|---|---|---|---|
| Number | Number | Percent | |
Total | 174 | 158 | 100 |
Violence and other injuries by persons or animals | 32 | 25 | 16 |
Intentional injury by person | 30 | 25 | 16 |
Intentional injury by other person | 18 | 16 | 10 |
Shooting by other person--intentional | 16 | 14 | 9 |
Self-inflicted injury--intentional | 12 | 9 | 6 |
Shooting--intentional self-harm | 7 | 3 | 2 |
Hanging, strangulation, asphyxiation--intentional self-harm | 4 | 5 | 3 |
Transportation incidents | 52 | 60 | 38 |
Aircraft incidents | -- | 2 | 1 |
Other in-flight crash | -- | 2 | 1 |
Other in-flight crash into structure, object, or ground | -- | 2 | 1 |
Pedestrian vehicular incident | 15 | 13 | 8 |
Pedestrian struck by vehicle in work zone | 3 | 4 | 3 |
Pedestrian struck by forward-moving vehicle in work zone | 3 | 3 | 2 |
Pedestrian struck by vehicle in nonroadway area | 1 | 6 | 4 |
Pedestrian struck by vehicle backing up in nonroadway area | 1 | 5 | 3 |
Roadway incidents involving motorized land vehicle | 31 | 39 | 25 |
Roadway collision with other vehicle | 18 | 26 | 16 |
Roadway collision--moving in same direction | 4 | 10 | 6 |
Roadway collision--moving in opposite directions, oncoming | 4 | 5 | 3 |
Roadway collision--moving perpendicularly | 5 | 11 | 7 |
Roadway collision with object other than vehicle | 8 | 10 | 6 |
Vehicle struck object or animal on side of roadway | 8 | 10 | 6 |
Roadway noncollision incident | 5 | 3 | 2 |
Nonroadway incident involving motorized land vehicles | 5 | 5 | 3 |
Nonroadway noncollision incident | 5 | 5 | 3 |
Jack-knifed or overturned, nonroadway | 4 | 4 | 3 |
Fires and explosions | 4 | 1 | 1 |
Fires | 1 | 1 | 1 |
Falls, slips, trips | 31 | 22 | 14 |
Falls on same level | 6 | 3 | 2 |
Falls to lower level | 25 | 19 | 12 |
Fall through surface or existing opening | 5 | 3 | 2 |
Other fall to lower level | 19 | 15 | 9 |
Other fall to lower level less than 6 feet | 4 | 4 | 3 |
Exposure to harmful substances or environments | 28 | 22 | 14 |
Exposure to electricity | 5 | 4 | 3 |
Indirect exposure to electricity | -- | 3 | 2 |
Indirect exposure to electricity, greater than 220 volts | -- | 3 | 2 |
Exposure to other harmful substances | 19 | 17 | 11 |
Nonmedical use of drugs or alcohol--unintentional overdose | 17 | 15 | 9 |
Exposure to oxygen deficiency, n.e.c. | 1 | 1 | 1 |
Drowning, submersion, n.e.c. | -- | 1 | 1 |
Contact with objects and equipment | 24 | 27 | 17 |
Struck by object or equipment | 18 | 20 | 13 |
Struck by powered vehicle--nontransport | 5 | 6 | 4 |
Struck by falling object or equipment--other than powered vehicle | 7 | 12 | 8 |
Struck by object falling from vehicle or machinery--other than vehicle part | -- | 7 | 4 |
Caught in or compressed by equipment or objects | 4 | 5 | 3 |
Caught in running equipment or machinery | -- | 3 | 2 |
Struck, caught, or crushed in collapsing structure, equipment, or material | -- | -- | -- |
Struck, caught, or crushed in other collapsing structure or equipment | -- | 1 | 1 |
Overexertion and bodily reaction | -- | -- | -- |
Footnotes: | |||
NOTE: Data for all years are final. Totals for major categories may include subcategories not shown separately. Percentages may not add to totals because of rounding. CFOI fatality counts exclude illness-related deaths unless precipitated by an injury event. Dashes indicate no data reported or data that do not meet publication criteria. | |||
| Industry (1) | 2017 | 2018 | |
|---|---|---|---|
| Number | Number | Percent | |
Total | 174 | 158 | 100 |
Private industry | 162 | 146 | 92 |
Goods producing | 59 | 60 | 38 |
Natural resources and mining | 12 | 18 | 11 |
Agriculture, forestry, fishing and hunting | 11 | 16 | 10 |
Crop production | 5 | 8 | 5 |
Oilseed and grain farming | -- | 2 | 1 |
Corn farming | -- | 1 | 1 |
Other grain farming | -- | 1 | 1 |
Greenhouse, nursery, and floriculture production | -- | 3 | 2 |
Nursery and floriculture production | -- | 3 | 2 |
Nursery and tree production | -- | 3 | 2 |
Animal production and aquaculture | 6 | 8 | 5 |
Cattle ranching and farming | 3 | 7 | 4 |
Dairy cattle and milk production | 3 | 5 | 3 |
Construction | 32 | 29 | 18 |
Construction | 32 | 29 | 18 |
Construction of buildings | 5 | 5 | 3 |
Residential building construction | 3 | 3 | 2 |
Residential building construction | 3 | 3 | 2 |
Heavy and civil engineering construction | 5 | 4 | 3 |
Highway, street, and bridge construction | -- | 3 | 2 |
Highway, street, and bridge construction | -- | 3 | 2 |
Specialty trade contractors | 20 | 18 | 11 |
Foundation, structure, and building exterior contractors | 11 | 4 | 3 |
Building equipment contractors | 3 | 5 | 3 |
Plumbing, heating, and air-conditioning contractors | -- | 3 | 2 |
Residential plumbing, heating, and air-conditioning contractors | -- | 1 | 1 |
Building finishing contractors | -- | 3 | 2 |
Finish carpentry contractors | -- | 1 | 1 |
Other specialty trade contractors | 5 | 3 | 2 |
Manufacturing | 15 | 13 | 8 |
Manufacturing | 15 | 13 | 8 |
Wood product manufacturing | -- | 1 | 1 |
Chemical manufacturing | -- | -- | -- |
Soap, cleaning compound, and toilet preparation manufacturing | -- | 1 | 1 |
Toilet preparation manufacturing | -- | 1 | 1 |
Service providing | 103 | 86 | 54 |
Trade, transportation, and utilities | 56 | 39 | 25 |
Wholesale trade | 9 | 7 | 4 |
Merchant wholesalers, durable goods | 4 | 4 | 3 |
Hardware, and plumbing and heating equipment and supplies merchant wholesalers | -- | 1 | 1 |
Plumbing and heating equipment and supplies (hydronics) merchant wholesalers | -- | 1 | 1 |
Merchant wholesalers, nondurable goods | 5 | 3 | 2 |
Drugs and druggists' sundries merchant wholesalers | -- | 1 | 1 |
Drugs and druggists' sundries merchant wholesalers | -- | 1 | 1 |
Grocery and related product wholesalers | 2 | -- | -- |
Meat and meat product merchant wholesalers | 1 | 1 | 1 |
Transportation and warehousing | 36 | 30 | 19 |
Truck transportation | 21 | 24 | 15 |
General freight trucking | 17 | 16 | 10 |
General freight trucking, local | 3 | 3 | 2 |
General freight trucking, long-distance | 12 | 11 | 7 |
General freight trucking, long-distance, truckload | 7 | 8 | 5 |
Specialized freight trucking | 4 | 7 | 4 |
Specialized freight (except used goods) trucking, local | 1 | 3 | 2 |
Specialized freight (except used goods) trucking, long-distance | 3 | 3 | 2 |
Scenic and sightseeing transportation | -- | 1 | 1 |
Scenic and sightseeing transportation, other | -- | 1 | 1 |
Support activities for transportation | 8 | 3 | 2 |
Information | -- | -- | -- |
Financial activities | 4 | 6 | 4 |
Finance and insurance | -- | 3 | 2 |
Real estate and rental and leasing | 3 | 3 | 2 |
Professional and business services | 22 | 21 | 13 |
Professional and technical services | 1 | 3 | 2 |
Professional, scientific, and technical services | 1 | 3 | 2 |
Other professional, scientific, and technical services | 1 | 3 | 2 |
Photographic services | -- | 2 | 1 |
Commercial photography | -- | 2 | 1 |
Veterinary services | 1 | 1 | 1 |
Administrative and waste services | 21 | 18 | 11 |
Administrative and support services | 18 | 17 | 11 |
Employment services | -- | 4 | 3 |
Services to buildings and dwellings | 11 | 13 | 8 |
Landscaping services | 11 | 10 | 6 |
Educational and health services | 9 | 4 | 3 |
Health care and social assistance | 8 | 4 | 3 |
Ambulatory health care services | -- | -- | -- |
Home health care services | -- | 1 | 1 |
Home health care services | -- | 1 | 1 |
Leisure and hospitality | 6 | 12 | 8 |
Accommodation and food services | 4 | 10 | 6 |
Accommodation | -- | 4 | 3 |
Traveler accommodation | -- | 4 | 3 |
Hotels (except casino hotels) and motels | -- | 4 | 3 |
Food services and drinking places | 4 | 6 | 4 |
Drinking places (alcoholic beverages) | 2 | 2 | 1 |
Drinking places (alcoholic beverages) | 2 | 2 | 1 |
Restaurants and other eating places | 2 | 3 | 2 |
Restaurants and other eating places | 2 | 3 | 2 |
Full-service restaurants | -- | 1 | 1 |
Other services, except public administration | 6 | 4 | 3 |
Other services, except public administration | 6 | 4 | 3 |
Repair and maintenance | 3 | 4 | 3 |
Automotive repair and maintenance | 1 | 4 | 3 |
Automotive body, paint, interior, and glass repair | -- | 1 | 1 |
Automotive body, paint, and interior repair and maintenance | -- | 1 | 1 |
Government (2) | 12 | 12 | 8 |
Federal government | 3 | 1 | 1 |
State government | -- | -- | -- |
Local government | 7 | 9 | 6 |
Footnotes: | |||
NOTE: Data for all years are final. Totals for major categories may include subcategories not shown separately. Percentages may not add to totals because of rounding. CFOI fatality counts exclude illness-related deaths unless precipitated by an injury event. Dashes indicate no data reported or data that do not meet publication criteria. | |||
| Occupation (1) | 2017 | 2018 | |
|---|---|---|---|
| Number | Number | Percent | |
Total | 174 | 158 | 100 |
Management occupations | 10 | 12 | 8 |
Top executives | -- | 1 | 1 |
Chief executives | -- | 1 | 1 |
Chief executives | -- | 1 | 1 |
Advertising, marketing, promotions, public relations, and sales managers | -- | 1 | 1 |
Marketing and sales managers | -- | 1 | 1 |
Sales managers | -- | 1 | 1 |
Other management occupations | 8 | 8 | 5 |
Farmers, ranchers, and other agricultural managers | 6 | 7 | 4 |
Farmers, ranchers, and other agricultural managers | 6 | 7 | 4 |
Business and financial operations occupations | -- | 3 | 2 |
Financial specialists | -- | 1 | 1 |
Financial analysts and advisors | -- | 1 | 1 |
Personal financial advisors | -- | 1 | 1 |
Computer and mathematical occupations | -- | -- | -- |
Architecture and engineering occupations | -- | -- | -- |
Life, physical, and social science occupations | -- | -- | -- |
Community and social services occupations | 4 | -- | -- |
Legal occupations | -- | -- | -- |
Education, training, and library occupations | 1 | -- | -- |
Arts, design, entertainment, sports, and media occupations | -- | -- | -- |
Media and communication equipment workers | -- | -- | -- |
Photographers | -- | 1 | 1 |
Photographers | -- | 1 | 1 |
Healthcare practitioners and technical occupations | 5 | -- | -- |
Health diagnosing and treating practitioners | 3 | 1 | 1 |
Veterinarians | 1 | 1 | 1 |
Veterinarians | 1 | 1 | 1 |
Healthcare support occupations | -- | -- | -- |
Protective service occupations | 8 | 9 | 6 |
Supervisors of protective service workers | 1 | 1 | 1 |
First-line supervisors of law enforcement workers | 1 | 1 | 1 |
First-line supervisors of police and detectives | 1 | 1 | 1 |
Law enforcement workers | 3 | 4 | 3 |
Police officers | 3 | 4 | 3 |
Police and sheriff's patrol officers | 3 | 4 | 3 |
Other protective service workers | 3 | 2 | 1 |
Security guards and gaming surveillance officers | 2 | 2 | 1 |
Security guards | 2 | 2 | 1 |
Food preparation and serving related occupations | 3 | 6 | 4 |
Food and beverage serving workers | -- | 1 | 1 |
Waiters and waitresses | -- | 1 | 1 |
Waiters and waitresses | -- | 1 | 1 |
Other food preparation and serving related workers | -- | 3 | 2 |
Dishwashers | -- | 1 | 1 |
Dishwashers | -- | 1 | 1 |
Miscellaneous food preparation and serving related workers | -- | 1 | 1 |
Building and grounds cleaning and maintenance occupations | 11 | 15 | 9 |
Building cleaning and pest control workers | -- | 5 | 3 |
Building cleaning workers | -- | 5 | 3 |
Janitors and cleaners, except maids and housekeeping cleaners | -- | 5 | 3 |
Grounds maintenance workers | 9 | 8 | 5 |
Grounds maintenance workers | 9 | 8 | 5 |
Landscaping and groundskeeping workers | 7 | 6 | 4 |
Personal care and service occupations | 5 | -- | -- |
Sales and related occupations | 7 | -- | -- |
Office and administrative support occupations | 3 | 4 | 3 |
Information and record clerks | -- | 1 | 1 |
Hotel, motel, and resort desk clerks | -- | 1 | 1 |
Hotel, motel, and resort desk clerks | -- | 1 | 1 |
Material recording, scheduling, dispatching, and distributing workers | -- | -- | -- |
Postal service workers | 1 | 1 | 1 |
Postal service mail carriers | 1 | 1 | 1 |
Farming, fishing, and forestry occupations | 3 | 8 | 5 |
Supervisors of farming, fishing, and forestry workers | -- | 3 | 2 |
First-line supervisors of farming, fishing, and forestry workers | -- | 3 | 2 |
First-line supervisors of farming, fishing, and forestry workers | -- | 3 | 2 |
Agricultural workers | 3 | 4 | 3 |
Miscellaneous agricultural workers | 3 | 4 | 3 |
Farmworkers, farm, ranch, and aquacultural animals | 1 | 4 | 3 |
Forest, conservation, and logging workers | -- | 1 | 1 |
Logging workers | -- | 1 | 1 |
Fallers | -- | 1 | 1 |
Construction and extraction occupations | 29 | 28 | 18 |
Supervisors of construction and extraction workers | 3 | 5 | 3 |
First-line supervisors of construction trades and extraction workers | 3 | 5 | 3 |
First-line supervisors of construction trades and extraction workers | 3 | 5 | 3 |
Construction trades workers | 25 | 21 | 13 |
Brickmasons, blockmasons, and stonemasons | -- | 1 | 1 |
Brickmasons and blockmasons | -- | 1 | 1 |
Carpenters | 7 | 3 | 2 |
Carpenters | 7 | 3 | 2 |
Construction laborers | 4 | 10 | 6 |
Construction laborers | 4 | 10 | 6 |
Pipelayers, plumbers, pipefitters, and steamfitters | 3 | 3 | 2 |
Installation, maintenance, and repair occupations | 14 | 6 | 4 |
Supervisors of installation, maintenance, and repair workers | -- | 1 | 1 |
First-line supervisors of mechanics, installers, and repairers | -- | 1 | 1 |
First-line supervisors of mechanics, installers, and repairers | -- | 1 | 1 |
Electrical and electronic equipment mechanics, installers, and repairers | 1 | 1 | 1 |
Miscellaneous electrical and electronic equipment mechanics, installers, and repairers | 1 | 1 | 1 |
Security and fire alarm systems installers | -- | 1 | 1 |
Vehicle and mobile equipment mechanics, installers, and repairers | 4 | 3 | 2 |
Production occupations | 15 | 4 | 3 |
Other production occupations | 4 | 1 | 1 |
Miscellaneous production workers | -- | 1 | 1 |
Transportation and material moving occupations | 50 | 55 | 35 |
Supervisors, transportation and material moving workers | -- | 1 | 1 |
First-line supervisors of transportation and material-moving machine and vehicle operators | -- | 1 | 1 |
First-line supervisors of transportation and material-moving machine and vehicle operators | -- | 1 | 1 |
Air transportation workers | -- | 2 | 1 |
Aircraft pilots and flight engineers | -- | 2 | 1 |
Commercial pilots | -- | 2 | 1 |
Motor vehicle operators | 41 | 39 | 25 |
Driver/sales workers and truck drivers | 38 | 38 | 24 |
Driver/sales workers | -- | 4 | 3 |
Heavy and tractor-trailer truck drivers | 33 | 30 | 19 |
Light truck or delivery services drivers | 3 | 4 | 3 |
Material moving workers | 9 | 13 | 8 |
Laborers and material movers, hand | 6 | 10 | 6 |
Laborers and freight, stock, and material movers, hand | 6 | 8 | 5 |
Military specific occupations (2) | -- | -- | -- |
Footnotes: | |||
NOTE: Totals for major categories may include subcategories not shown separately. Percentages may not add to totals because of rounding. CFOI fatality counts exclude illness-related deaths unless precipitated by an injury event. Dashes indicate no data reported or data that do not meet publication criteria. | |||
| Worker characteristics | 2017 | 2018 | |
|---|---|---|---|
| Number | Number | Percent | |
Total | 174 | 158 | 100 |
Employee status | |||
Wage and salary workers (1) | 148 | 124 | 78 |
Self-employed (2) | 26 | 34 | 22 |
Gender | |||
Men | 152 | 146 | 92 |
Women | 22 | 12 | 8 |
Age (3) | |||
18 to 19 years | 4 | 1 | 1 |
20 to 24 years | 9 | 10 | 6 |
25 to 34 years | 29 | 23 | 15 |
35 to 44 years | 27 | 31 | 20 |
45 to 54 years | 38 | 37 | 23 |
55 to 64 years | 44 | 35 | 22 |
65 years and over | 22 | 20 | 13 |
Race or ethnic origin (4) | |||
White, non-Hispanic | 138 | 120 | 76 |
Black or African-American, non-Hispanic | 15 | 22 | 14 |
Hispanic or Latino | 15 | 11 | 7 |
Asian, non-Hispanic | 5 | 4 | 3 |
Footnotes: | |||
NOTE: Data for all years are final. Totals for major categories may include subcategories not shown separately. Percentages may not add to totals because of rounding. CFOI fatality counts exclude illness-related deaths unless precipitated by an injury event. Dashes indicate no data reported or data that do not meet publication criteria. | |||
Last Modified Date: Tuesday, February 25, 2020