An official website of the United States government
An official website of the United States government
The .gov means it's official.
Federal government websites often end in .gov or .mil. Before sharing sensitive information,
make sure you're on a federal government site.
The site is secure.
The
https:// ensures that you are connecting to the official website and that any
information you provide is encrypted and transmitted securely.
19-1952-CHI
Tuesday, March 03, 2020
Michigan’s private sector employers reported 90,900 nonfatal workplace injuries and illnesses in 2018, resulting in an incidence rate of 3.0 cases per 100 full-time equivalent workers, the U.S. Bureau of Labor Statistics reported today. (See table A.) Assistant Commissioner for Regional Operations Charlene Peiffer noted that Michigan was among 22 states that had an incidence rate of total recordable cases (TRC) significantly higher than the national rate of 2.8. (Michigan was 1 of 41 states and the District of Columbia for which statewide estimates are available. See Technical Note at the end of this release for more information about the survey.)
Michigan’s findings from the 2018 Survey of Occupational Injuries and Illnesses include:
TRC incidence rates in private industry ranged from 0.9 in information to 4.2 in education and health services. (See table 1.)
Three supersectors, with 55 percent of private industry employment, accounted for 74 percent of the occupational injuries and illnesses: manufacturing; education and health services; and trade, transportation, and utilities. (See table 2.)
In private industry, the TRC injury and illness incidence rate ranged from 1.0 for establishments employing fewer than 11 workers to 3.6 for establishments employing 50 to 249 workers. (See table 3.)
Michigan’s private industry TRC rate of 3.0 in 2018 was similar to the rate in 2017. (See table 4.)
| Characteristic | United States | Michigan | ||
|---|---|---|---|---|
| Number (in thousands) | Rate (per 100 workers) | Number (in thousands) | Rate (per 100 workers) | |
Total cases | 2,834.5 | 2.8 | 90.9 | 3.0 |
Cases with days away from work, job transfer, or restriction | 1,578.7 | 1.6 | 47.4 | 1.6 |
Cases with days away from work | 900.4 | 0.9 | 23.5 | 0.8 |
Cases with job transfer or restriction | 678.3 | 0.7 | 23.9 | 0.8 |
Other recordable cases | 1,255.9 | 1.3 | 43.5 | 1.4 |
Note: Because of rounding, components may not add to totals. | ||||
Of the 90,900 private industry injury and illness cases reported in Michigan, 47,400 were of a more severe nature, involving days away from work, job transfer, or restriction—commonly referred to as DART cases. These cases occurred at a rate of 1.6 cases per 100 full-time workers. Fifty percent of the DART cases in Michigan were incidents that resulted in at least one day away from work, compared to 57 percent nationally. Other recordable cases (those not involving days away from work, job transfer, or restriction) accounted for the remaining 43,500 cases in Michigan, at a rate of 1.4. In comparison, the national rate for other recordable cases was 1.3.
In Michigan, the information supersector had significant declines in both the TRC incidence rate and DART incidence rate from the previous year. The manufacturing supersector had a significant increase in the DART incidence rate. No other private industry supersector had a significant change in either the TRC incidence rate or the DART incidence rate from the previous year.
In 2018, 86,300, or 94.9 percent, of private industry recordable injuries and illnesses in Michigan were injuries. Workplace illnesses accounted for an additional 4,600 recordable cases. Three categories—hearing loss, skin disorders, and respiratory conditions—accounted for 43.5 percent of the occupational illnesses in Michigan. Nationally, these three categories amounted to 36.8 percent of the work-related illness total.
State and local government injury and illness casesIn the state and local government sector in Michigan, 13,900 injury and illness cases were reported in 2018, resulting in a rate of 3.9 cases per 100 full-time workers. Nationally, the rate was 4.8. Almost 76 percent of injuries and illnesses reported in Michigan’s public sector occurred among local government workers.
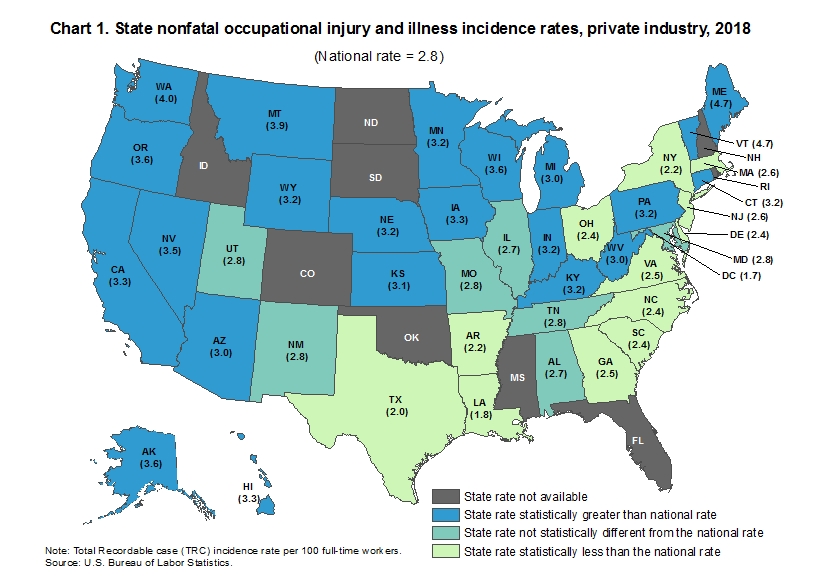
State estimatesPrivate industry and public sector estimates are available for 41 participating states and the District of Columbia for 2018. The private industry injury and illness rate was statistically higher than the national rate of 2.8 cases per 100 full-time workers in 22 states, lower in 12 states and in the District of Columbia, and not statistically different in 7 states. (See chart 1.) Caution should be taken when comparing rates among different states as some differences can be attributed to different industry composition within each state.
The Survey of Occupational Injuries and Illnesses (SOII) is a Federal/State cooperative program that publishes estimates on nonfatal occupational injuries and illnesses. Each year, approximately 200,000 employers report for establishments in private industry and the public sector (state and local government). In-scope cases include work-related injuries or illnesses to workers who require medical care beyond first aid. See the Occupational Safety and Health Administration (OSHA) for the entire recordkeeping guidelines. The SOII excludes all work–related fatalities as well as nonfatal work injuries and illnesses to the self–employed; to workers on farms with 10 or fewer employees; to private household workers; to volunteers; and to federal government workers. For more information on the scope and sampling methodology see the SOII Handbook of Methods.
Additional occupational injury and illness data are available from our regional web page at www.bls.gov/regions/midwest.
Information in this release will be made available to sensory impaired individuals upon request. Voice phone: (202)-691-5200; Federal Relay Service: (800)-877-8339.
| Industry(1)(2)(3) | Total recordable cases | Cases with days away from work, job transfer, or restriction | Other recordable cases | ||
|---|---|---|---|---|---|
| Total | Cases with days away from work(4) | Cases with job transfer or restriction | |||
All industries including state and local government | 3.1 | 1.6 | 0.8 | 0.8 | 1.5 |
Private industry | 3.0 | 1.6 | 0.8 | 0.8 | 1.4 |
Goods-producing | 3.8 | 2.1 | 1.0 | 1.1 | 1.7 |
Natural resources and mining | 3.9 | 2.3 | 1.6 | 0.7 | 1.6 |
Construction | 2.6 | 1.5 | 1.0 | 0.5 | 1.1 |
Manufacturing | 4.1 | 2.3 | 1.0 | 1.3 | 1.8 |
Service-providing | 2.7 | 1.3 | 0.7 | 0.7 | 1.3 |
Trade, transportation, and utilities | 3.1 | 2.0 | 0.9 | 1.0 | 1.2 |
Information | 0.9 | 0.5 | 0.2 | 0.2 | 0.4 |
Financial activities | 1.3 | 0.5 | 0.4 | 0.1 | 0.8 |
Professional and business services | 1.1 | 0.6 | 0.3 | 0.3 | 0.5 |
Education and health services | 4.2 | 1.9 | 0.9 | 1.0 | 2.3 |
Leisure and hospitality | 3.1 | 1.1 | 0.7 | 0.4 | 2.1 |
Other services, except public administration | 1.9 | 0.9 | 0.5 | 0.4 | 1.1 |
State and local government | 3.9 | 2.1 | 1.4 | 0.7 | 1.8 |
State government | 2.8 | 1.5 | 0.8 | 0.7 | 1.3 |
Local government | 4.4 | 2.4 | 1.7 | 0.7 | 2.0 |
Footnotes: | |||||
Note: Because of rounding, components may not add to totals. Dashes indicate data not available. | |||||
| Industry(1)(2)(3) | Total recordable cases | Cases with days away from work, job transfer, or restriction | Other recordable cases | ||
|---|---|---|---|---|---|
| Total | Cases with days away from work(4) | Cases with job transfer or restriction | |||
All industries including state and local government | 104.8 | 54.9 | 28.5 | 26.4 | 50.0 |
Private industry | 90.9 | 47.4 | 23.5 | 23.9 | 43.5 |
Goods-producing | 31.3 | 17.5 | 8.4 | 9.2 | 13.7 |
Natural resources and mining | 1.3 | 0.8 | 0.5 | 0.2 | 0.5 |
Construction | 4.1 | 2.3 | 1.6 | 0.8 | 1.7 |
Manufacturing | 26.0 | 14.5 | 6.3 | 8.2 | 11.5 |
Service-providing | 59.6 | 29.8 | 15.1 | 14.7 | 29.8 |
Trade, transportation, and utilities | 20.0 | 12.5 | 6.0 | 6.6 | 7.5 |
Information | 0.4 | 0.2 | 0.1 | 0.1 | 0.2 |
Financial activities | 2.4 | 0.9 | 0.7 | 0.2 | 1.5 |
Professional and business services | 5.5 | 3.0 | 1.7 | 1.3 | 2.4 |
Education and health services | 20.9 | 9.4 | 4.3 | 5.1 | 11.5 |
Leisure and hospitality | 8.6 | 2.9 | 1.9 | 1.0 | 5.7 |
Other services, except public administration | 1.8 | 0.8 | 0.5 | 0.3 | 1.0 |
State and local government | 13.9 | 7.5 | 5.0 | 2.5 | 6.4 |
State government | 3.4 | 1.8 | 1.0 | 0.8 | 1.6 |
Local government | 10.5 | 5.7 | 4.0 | 1.7 | 4.9 |
Footnotes: | |||||
Note: Because of rounding, components may not add to totals. Dashes indicate data not available. | |||||
| Industry(1)(2)(3) | All establishments | Establishment employment size (workers) | ||||
|---|---|---|---|---|---|---|
| 1 to 10 | 11 to 49 | 50 to 249 | 250 to 999 | 1,000 or more | ||
All industries including state and local government | 3.1 | 1.0 | 2.7 | 3.6 | 3.5 | 3.4 |
Private industry | 3.0 | 1.0 | 2.6 | 3.6 | 3.3 | 3.2 |
Goods-producing | 3.8 | - | 4.3 | 4.6 | 3.7 | 3.1 |
Natural resources and mining | 3.9 | - | 4.1 | 3.5 | - | - |
Construction | 2.6 | - | 3.6 | 2.6 | 1.2 | 1.5 |
Manufacturing | 4.1 | 0.8 | 4.9 | 5.1 | 4.0 | 3.2 |
Service-providing | 2.7 | - | 2.1 | 3.3 | 3.1 | 3.2 |
Trade, transportation, and utilities | 3.1 | - | 2.6 | 3.8 | 3.7 | 2.7 |
Information | 0.9 | (4) | 1.2 | 0.6 | 0.7 | 2.6 |
Financial activities | 1.3 | - | 0.6 | 1.5 | 1.5 | 0.7 |
Professional and business services | 1.1 | - | 1.6 | 1.7 | 1.1 | 0.6 |
Education and health services | 4.2 | - | 2.2 | 4.5 | 4.6 | 5.5 |
Leisure and hospitality | 3.1 | - | 2.5 | 4.0 | 5.0 | 3.3 |
Other services, except public administration | 1.9 | - | - | 3.0 | 4.6 | - |
State and local government | 3.9 | 0.8 | 3.4 | 3.0 | 4.6 | 4.3 |
State government | 2.8 | (4) | - | 1.4 | 3.9 | 2.9 |
Local government | 4.4 | 1.6 | 3.4 | 3.3 | 4.7 | 6.1 |
Footnotes: | ||||||
Note: Because of rounding, components may not add to totals. Dashes indicate data not available. | ||||||
| Industry(1)(2)(3) | Total recordable cases | Cases with days away from work, job transfer, or restriction (4) | ||
|---|---|---|---|---|
| 2017 | 2018 | 2017 | 2018 | |
All industries including state and local government | 3.3 | 3.1* | 1.6 | 1.6 |
Private industry | 3.1 | 3.0 | 1.6 | 1.6 |
Goods-producing | 4.0 | 3.8 | 2.0 | 2.1 |
Natural resources and mining | 5.3 | 3.9 | 2.1 | 2.3 |
Construction | 3.3 | 2.6 | 1.6 | 1.5 |
Manufacturing | 4.1 | 4.1 | 2.1 | 2.3* |
Service-providing | 2.8 | 2.7 | 1.4 | 1.3 |
Trade, transportation, and utilities | 3.3 | 3.1 | 1.9 | 2.0 |
Information | 1.6 | 0.9* | 1.0 | 0.5* |
Financial activities | 0.8 | 1.3 | 0.4 | 0.5 |
Professional and business services | 1.2 | 1.1 | 0.5 | 0.6 |
Education and health services | 4.4 | 4.2 | 2.0 | 1.9 |
Leisure and hospitality | 3.4 | 3.1 | 1.3 | 1.1 |
Other services, except public administration | 2.6 | 1.9 | 1.6 | 0.9 |
State and local government | 4.3 | 3.9 | 2.1 | 2.1 |
State government | 2.9 | 2.8 | 1.6 | 1.5 |
Local government | 5.0 | 4.4 | 2.4 | 2.4 |
Footnotes: | ||||
Note: Dashes indicate data not available. | ||||
Last Modified Date: Tuesday, March 03, 2020