An official website of the United States government
An official website of the United States government
The .gov means it's official.
Federal government websites often end in .gov or .mil. Before sharing sensitive information,
make sure you're on a federal government site.
The site is secure.
The
https:// ensures that you are connecting to the official website and that any
information you provide is encrypted and transmitted securely.
22-360-CHI
Wednesday, April 06, 2022
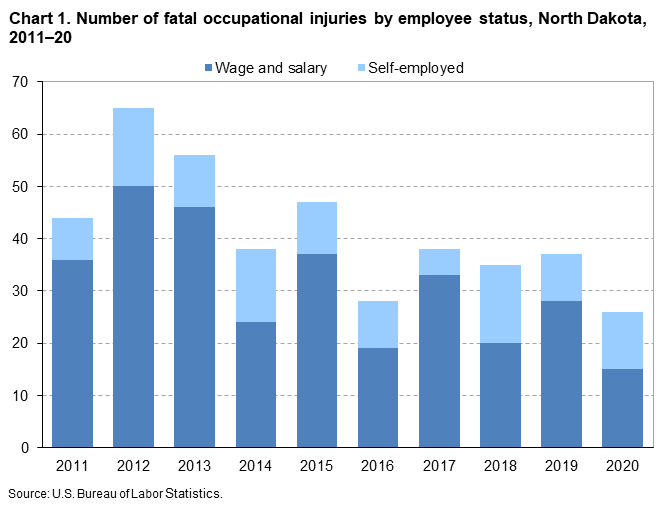
Fatal work injuries totaled 26 in 2020 for North Dakota, the U.S. Bureau of Labor Statistics reported today. Regional Commissioner Jason Palmer noted that the number of work-related fatalities in North Dakota was down from the previous year. (See chart 1.) Fatal occupational injuries in the state have ranged from a high of 65 in 2012 to a low of 20 in 1992.
Nationwide, a total of 4,764 fatal work injuries were recorded in 2020, an 11-percent decrease from 5,333 in 2019, according to the results from the Census of Fatal Occupational Injuries (CFOI). The 4,764 fatal occupational injuries in 2020 represents the lowest annual number since 2013.
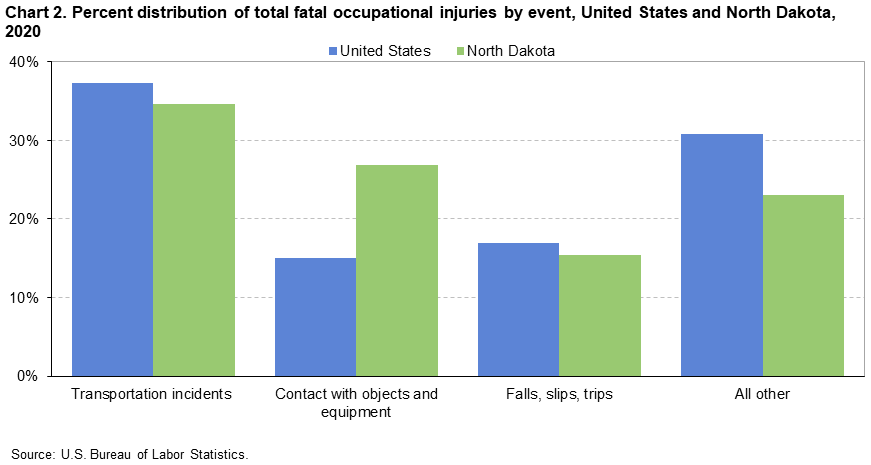
In North Dakota, transportation incidents resulted in nine fatal work injuries, and contact with objects or equipment accounted for seven fatalities. These two major categories accounted for 62 percent of all fatal workplace injuries in the state. (See chart 2 and table 1.) Worker deaths from transportation incidents were down from 12 over the year, and worker fatalities due to contact with objects or equipment were down from 9. Falls, slips, or trips was the third-most frequent fatal work event with four fatalities.
Nationally, transportation incidents were the most frequent fatal workplace event in 2020, accounting for 37 percent of fatal work injuries. Falls, slips, and trips was the second-most common fatal event (17 percent).
The private agriculture, forestry, fishing, and hunting industry sector had the highest number of fatalities in North Dakota with 13, up from 7 in the previous year. (See table 2.) Transportation incidents resulted in 4 of the 13 fatalities in the industry. The crop production subsector accounted for 8 of the 13 fatal workplace injuries in the agriculture, forestry, fishing, and hunting industry.
The private construction industry sector had the second highest number of fatal workplace injuries with seven, up from six in the previous year.
OccupationThe management occupational group had the highest number of fatal workplace injuries with 12. (See table 3.) The construction and extraction occupational group had the second-highest number of fatal workplace injuries with six. Construction laborers suffered four of the work-related deaths within the construction and extraction group.
Additional highlightsMen accounted for 96 percent of the work-related fatalities in North Dakota, compared to the 92-percent national share. (See table 4.) Transportation incidents made up 36 percent of the fatalities for men in North Dakota.
White non-Hispanics accounted for 81 percent of those who died from a workplace injury. Nationwide, this group accounted for 61 percent of work-related deaths.
Workers at least 65 years old accounted for 31 percent of the state’s work-related fatalities in 2020, compared to 14 percent of on-the-job fatalities nationally.
Of the 26 fatal work injuries in North Dakota, 58 percent worked for wages and salaries; the remainder were self-employed. The most frequent fatal event for wage and salary workers was transportation incidents. Both transportation incidents and contact with objects and equipment were the most frequent fatal events for self-employed workers.
CFOI reports fatal workplace injuries only. These may include fatal workplace injuries complicated by an illness such as COVID-19. Fatal workplace illnesses not precipitated by an injury are not in scope for CFOI. CFOI does not report any illness related information, including COVID-19. Additional information is available at https://www.bls.gov/covid19/effects-of-covid-19-on-workplace-injuries-and-illnesses-compensation-and-occupational-requirements.htm.
Background of the program. The Census of Fatal Occupational Injuries (CFOI), part of the Bureau of Labor Statistics (BLS) Occupational Safety and Health Statistics (OSHS) program, is a count of all fatalities resulting from workplace injuries occurring in the U.S. during the calendar year. The CFOI uses a variety of state, federal, and independent data sources to identify, verify, and describe fatal work injuries. This ensures counts are as complete and accurate as possible. For the 2020 national data, over 21,600 unique source documents were reviewed as part of the data collection process. For technical information and definitions for the CFOI, see the BLS Handbook of Methods at www.bls.gov/opub/hom/cfoi/home.htm and the CFOI definitions at www.bls.gov/iif/oshcfdef.htm.
Federal/State agency coverage. The CFOI includes data for all fatal work injuries, some of which may be outside the scope of other agencies or regulatory coverage. Comparisons between CFOI counts and those released by other agencies should account for the different coverage requirements and definitions used by each agency. For more information on the scope of CFOI, see www.bls.gov/iif/cfoiscope.htm and www.bls.gov/opub/hom/cfoi/concepts.htm.
Acknowledgments. BLS appreciates the efforts of all federal, state, local, and private sector entities that provided source documents used to identify fatal work injuries. Among these agencies are the Occupational Safety and Health Administration; the National Transportation Safety Board; the U.S. Coast Guard; the Mine Safety and Health Administration; the Office of Workers’ Compensation Programs (Federal Employees' Compensation and Longshore and Harbor Workers' Compensation divisions); the Federal Railroad Administration; the National Highway Traffic Safety Administration; state vital statistics registrars, coroners, and medical examiners; state departments of health, labor, and industrial relations and workers' compensation agencies; state and local police departments; and state farm bureaus.
Information in this release will be made available to individuals with sensory impairments upon request. Voice phone: (202) 691-5200; Telecommunications Relay Service: 7-1-1.
| Event or exposure (1) | 2019 | 2020 | |
|---|---|---|---|
| Number | Number | Percent | |
Total | 37 | 26 | 100 |
Transportation incidents | 12 | 9 | 35 |
Roadway incidents involving motorized land vehicle | 9 | 5 | 19 |
Roadway collision with other vehicle | 5 | 4 | 15 |
Roadway noncollision incident | 3 | 1 | 4 |
Jack-knifed or overturned, roadway | -- | 1 | 4 |
Nonroadway incident involving motorized land vehicles | 1 | 3 | 12 |
Falls, slips, trips | -- | 4 | 15 |
Falls to lower level | -- | 4 | 15 |
Contact with objects and equipment | 9 | 7 | 27 |
Struck by object or equipment | 5 | 3 | 12 |
Footnotes: | |||
NOTE: Data for all years are final. Totals for major categories may include subcategories not shown separately. For complete information on how the data are coded and presented see our definitions page at https://www.bls.gov/iif/oshcfdef.htm. Dashes indicate no data reported or data that do not meet publication criteria. CFOI fatal injury counts exclude illness-related deaths unless precipitated by an injury event. | |||
| Industry (1) | 2019 | 2020 | |
|---|---|---|---|
| Number | Number | Percent | |
Total | 37 | 26 | 100 |
Private industry (2) | 35 | 24 | 92 |
Goods producing | -- | -- | -- |
Natural resources and mining | 10 | 13 | 50 |
Agriculture, forestry, fishing and hunting | 7 | 13 | 50 |
Crop production | -- | 8 | 31 |
Oilseed and grain farming | -- | 6 | 23 |
Wheat farming | -- | 4 | 15 |
Corn farming | -- | 1 | 4 |
Other grain farming | -- | 1 | 4 |
Oilseed and grain combination farming | -- | 1 | 4 |
Animal production and aquaculture | 4 | 5 | 19 |
Cattle ranching and farming | 4 | 5 | 19 |
Construction | 6 | 7 | 27 |
Construction | 6 | 7 | 27 |
Government (3) | 2 | 2 | 8 |
State government | -- | 1 | 4 |
Local government | 1 | 1 | 4 |
Footnotes: | |||
NOTE: Data for all years are final. Totals for major categories may include subcategories not shown separately. For complete information on how the data are coded and presented see our definitions page at https://www.bls.gov/iif/oshcfdef.htm. Dashes indicate no data reported or data that do not meet publication criteria. CFOI fatal injury counts exclude illness-related deaths unless precipitated by an injury event. | |||
| Occupation (1) | 2019 | 2020 | |
|---|---|---|---|
| Number | Number | Percent | |
Total | 37 | 26 | 100 |
Management occupations | 5 | 12 | 46 |
Construction and extraction occupations | 9 | 6 | 23 |
Construction trades workers | 4 | 6 | 23 |
Construction laborers | -- | 4 | 15 |
Construction laborers | -- | 4 | 15 |
Footnotes: | |||
NOTE: Data for all years are final. Totals for major categories may include subcategories not shown separately. For complete information on how the data are coded and presented see our definitions page at https://www.bls.gov/iif/oshcfdef.htm. Dashes indicate no data reported or data that do not meet publication criteria. CFOI fatal injury counts exclude illness-related deaths unless precipitated by an injury event. | |||
| Worker characteristics | 2019 | 2020 | |
|---|---|---|---|
| Number | Number | Percent | |
Total | 37 | 26 | 100 |
Employee status | |||
Wage and salary workers (1) | 28 | 15 | 58 |
Self-employed (2) | 9 | 11 | 42 |
Gender | |||
Men | 35 | 25 | 96 |
Women | 2 | 1 | 4 |
Age (3) | |||
25 to 34 years | 8 | 8 | 31 |
45 to 54 years | 9 | 4 | 15 |
55 to 64 years | 9 | 4 | 15 |
65 years and over | 4 | 8 | 31 |
Race or ethnic origin (4) | |||
White, non-Hispanic | 32 | 21 | 81 |
Black or African-American, non-Hispanic | -- | -- | -- |
Hispanic or Latino | -- | -- | -- |
Footnotes: | |||
NOTE: Data for all years are final. Totals for major categories may include subcategories not shown separately. For complete information on how the data are coded and presented see our definitions page at https://www.bls.gov/iif/oshcfdef.htm. Dashes indicate no data reported or data that do not meet publication criteria. CFOI fatal injury counts exclude illness-related deaths unless precipitated by an injury event. | |||
Last Modified Date: Wednesday, April 06, 2022