An official website of the United States government
An official website of the United States government
The .gov means it's official.
Federal government websites often end in .gov or .mil. Before sharing sensitive information,
make sure you're on a federal government site.
The site is secure.
The
https:// ensures that you are connecting to the official website and that any
information you provide is encrypted and transmitted securely.
23-133-CHI
Friday, February 24, 2023
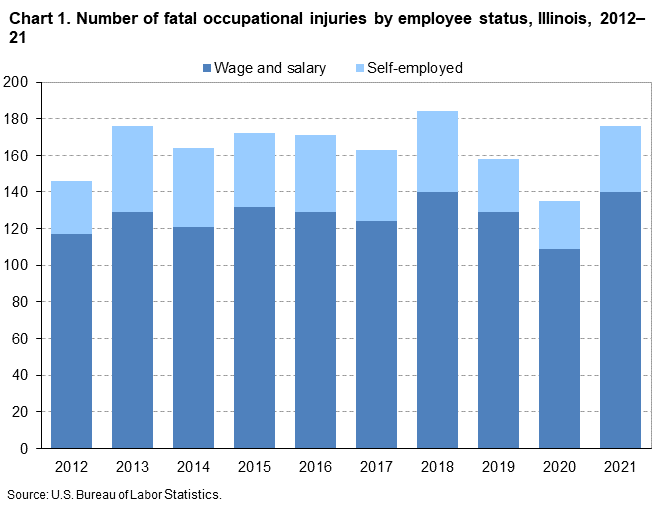
Fatal work injuries totaled 176 in 2021 for Illinois, the U.S. Bureau of Labor Statistics reported today. Regional Commissioner Jason Palmer noted that the number of work-related fatalities in Illinois was up from the previous year. (See chart 1.) Fatal occupational injuries in the state have ranged from a high of 262 in 1996 to a low of 135 in 2020.
Nationwide, a total of 5,190 fatal work injuries were recorded in 2021, a 9-percent increase from 4,764 in 2020, according to the results from the Census of Fatal Occupational Injuries (CFOI).
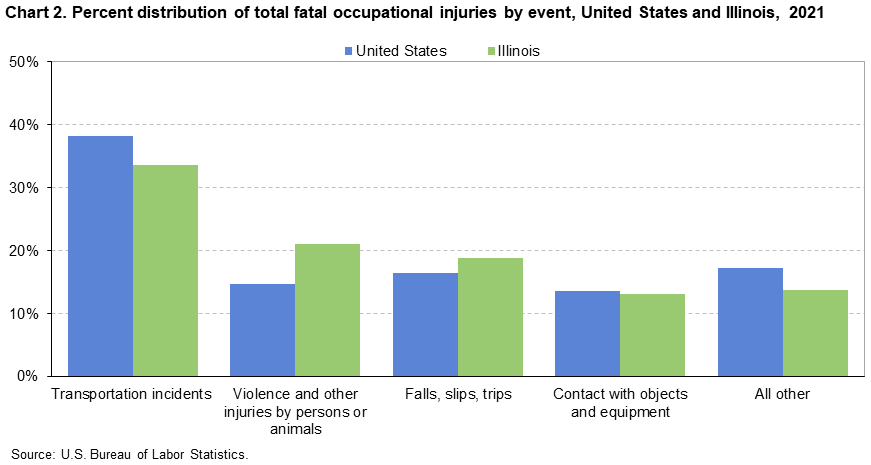
In Illinois, transportation incidents resulted in 59 fatal work injuries and accounted for 34 percent of all fatal workplace injuries in the state. (See chart 2 and table 1.) Worker deaths from transportation incidents were up from 55 over the year.
Violence and other injuries by persons or animals was the second-most frequent fatal work event with 37 fatalities, up from 22 in the prior year. Falls, slips, or trips resulted in 33 work-related fatalities, up from 24 in the prior year. Contact with objects or equipment resulted in 23 work-related deaths compared to 17 in 2020.
Nationally, transportation incidents were the most frequent fatal event in 2021, accounting for 38 percent of fatal work injuries. Falls, slips, and trips was the second-most common fatal event (16 percent), followed by both exposure to harmful substances or environments and violence and other injuries by persons or animals (15 percent each) and contact with objects and equipment (14 percent).
The private transportation and warehousing industry sector had the highest number of fatalities in Illinois with 41, up from 27 in the previous year. (See table 2.) Transportation incidents resulted in 18 of the 41 fatalities in the industry. The truck transportation subsector accounted for 25 of the 41 fatal workplace injuries in the transportation and warehousing industry.
The private construction and manufacturing industry sectors each had 19 fatal workplace injuries. Construction fatalities were down from 21 in the previous year, while manufacturing fatalities were up from 13. The specialty trade contractors subsector accounted for 16, or 84 percent, of the fatal injuries in the construction industry.
OccupationThe transportation and material moving occupational group had the highest number of fatal workplace injuries with 64. (See table 3.) Motor vehicle operators accounted for 42 of the 64 fatalities among transportation and material moving workers.
The protective service occupational group had the second-highest number of fatal workplace injuries with 20, followed by management occupations (17), construction and extraction occupations (16), and installation, maintenance, and repair occupations (14). Security guards suffered 6 of the work-related deaths within the protective service group.
Additional highlightsMen accounted for 89 percent of the work-related fatalities in Illinois, compared to the 91-percent national share. (See table 4.) Transportation incidents made up 34 percent of the fatalities for men in Illinois.
White non-Hispanics accounted for 61 percent of those who died from a workplace injury. Nationwide, this group accounted for 60 percent of work-related deaths.
Workers 55 years and older accounted for 41 percent of the state’s work-related fatalities in 2021, compared to 35 percent of on-the-job fatalities nationally.
Of the 176 fatal work injuries in Illinois, 80 percent worked for wages and salaries; the remainder were self-employed. The most frequent fatal event for wage and salary workers, as well as self-employed workers was transportation incidents.
Background of the program. The Census of Fatal Occupational Injuries (CFOI), part of the Bureau of Labor Statistics (BLS) Occupational Safety and Health Statistics (OSHS) program, is a count of all fatalities resulting from workplace injuries occurring in the U.S. during the calendar year. The CFOI uses a variety of state, federal, and independent data sources to identify, verify, and describe fatal work injuries. This ensures counts are as complete and accurate as possible. For the 2021 national data, over 23,900 unique source documents were reviewed as part of the data collection process. For technical information and definitions for the CFOI, see the BLS Handbook of Methods at www.bls.gov/opub/hom/cfoi/home.htm and the CFOI definitions at www.bls.gov/iif/definitions/occupational-safety-and-health-definitions.htm.
Federal/State agency coverage. The CFOI includes data for all fatal work injuries, some of which may be outside the scope of other agencies or regulatory coverage. Comparisons between CFOI counts and those released by other agencies should account for the different coverage requirements and definitions used by each agency. For more information on the scope of CFOI, see www.bls.gov/iif/overview/cfoi-scope.htm and www.bls.gov/opub/hom/cfoi/concepts.htm.
Latency Cases. Latent fatal occupational injury cases occur when the date of injury differs from the date of death. In some cases, the death occurs in a different year than the occupational injury and are known as cross-year latent cases. In 2021, there were 197 cases nationally where this occurred, and 174 of these latent cases occurred more than 30 days prior to the start of 2021. For more information on latent cases, see www.bls.gov/opub/btn/volume-10/latency-in-fatal-occupational-injuries.htm.
Coronavirus (COVID-19) Pandemic and the Census of Fatal Occupational Injuries. CFOI reports fatal workplace injuries only. These may include fatal workplace injuries complicated by an illness such as COVID-19. Fatal workplace illnesses not precipitated by an injury are not in scope for CFOI. CFOI does not report any illness related information, including COVID-19. Additional information is available at www.bls.gov/covid19/effects-of-covid-19-on-workplace-injuries-and-illnesses-compensation-and-occupational-requirements.htm.
Acknowledgments. BLS thanks the Illinois Department of Public Health for their efforts in collecting accurate, comprehensive, and useful data on fatal work injuries. BLS also appreciates the efforts of all federal, state, local, and private sector entities that provided source documents used to identify fatal work injuries. Among these agencies are the Occupational Safety and Health Administration; the National Transportation Safety Board; the U.S. Coast Guard; the Mine Safety and Health Administration; the Office of Workers’ Compensation Programs (Federal Employees' Compensation and Longshore and Harbor Workers' Compensation divisions); the Federal Railroad Administration; the National Highway Traffic Safety Administration; state vital statistics registrars, coroners, and medical examiners; state departments of health, labor, and industrial relations and workers' compensation agencies; state and local police departments; and state farm bureaus.
Information in this release will be made available to individuals with sensory impairments upon request. Voice phone: (202) 691-5200; Telecommunications Relay Service: 7-1-1.
| Event or exposure (1) | 2020 | 2021 | |
|---|---|---|---|
| Number | Number | Percent | |
Total | 135 | 176 | 100 |
Violence and other injuries by persons or animals | 22 | 37 | 21 |
Intentional injury by person | 21 | 36 | 20 |
Self-inflicted injury--intentional | 7 | 7 | 4 |
Transportation incidents | 55 | 59 | 34 |
Pedestrian vehicular incident | 10 | 13 | 7 |
Pedestrian struck by vehicle in roadway | -- | 3 | 2 |
Pedestrian struck by forward-moving vehicle in roadway | -- | 3 | 2 |
Pedestrian struck by vehicle in nonroadway area | 3 | 9 | 5 |
Pedestrian struck by vehicle backing up in nonroadway area | -- | 5 | 3 |
Roadway incidents involving motorized land vehicle | 30 | 37 | 21 |
Roadway collision with other vehicle | 15 | 24 | 14 |
Roadway collision--moving in same direction | 4 | 8 | 5 |
Roadway collision--moving in opposite directions, oncoming | 1 | 6 | 3 |
Roadway collision--moving and standing vehicle in roadway | 3 | 4 | 2 |
Roadway collision with object other than vehicle | 7 | 6 | 3 |
Vehicle struck object or animal on side of roadway | 6 | 6 | 3 |
Roadway noncollision incident | 8 | 7 | 4 |
Ran off roadway | -- | 5 | 3 |
Nonroadway incident involving motorized land vehicles | 9 | 9 | 5 |
Nonroadway collision with object other than vehicle | -- | 3 | 2 |
Nonroadway noncollision incident | 7 | 6 | 3 |
Fires and explosions | -- | 3 | 2 |
Fires | -- | 3 | 2 |
Vehicle or machinery fire | -- | 1 | 1 |
Falls, slips, trips | 24 | 33 | 19 |
Falls to lower level | 16 | 26 | 15 |
Other fall to lower level | -- | 23 | 13 |
Other fall to lower level less than 6 feet | -- | 5 | 3 |
Other fall to lower level 26 to 30 feet | -- | 3 | 2 |
Other fall to lower level more than 30 feet | -- | 5 | 3 |
Exposure to harmful substances or environments | -- | 21 | 12 |
Exposure to other harmful substances | -- | 15 | 9 |
Nonmedical use of drugs or alcohol--unintentional overdose | -- | 15 | 9 |
Contact with objects and equipment | 17 | 23 | 13 |
Struck by object or equipment | 12 | 11 | 6 |
Struck by powered vehicle--nontransport | -- | 6 | 3 |
Struck or run over by rolling powered vehicle | -- | 3 | 2 |
Struck by swinging part of powered vehicle | -- | 1 | 1 |
Struck by falling object or equipment--other than powered vehicle | 6 | 3 | 2 |
Caught in or compressed by equipment or objects | 3 | 3 | 2 |
Struck, caught, or crushed in collapsing structure, equipment, or material | 2 | 9 | 5 |
Footnotes: | |||
NOTE: Data for all years are final. Totals for major categories may include subcategories not shown separately. For complete information on how the data are coded and presented see our definitions page at https://www.bls.gov/iif/definitions/census-of-fatal-occupational-injuries-definitions.htm. Dashes indicate no data reported or data that do not meet publication criteria. CFOI fatal injury counts exclude illness-related deaths unless precipitated by an injury event. | |||
| Industry (1) | 2020 | 2021 | |
|---|---|---|---|
| Number | Number | Percent | |
Total | 135 | 176 | 100 |
Private industry (2) | 126 | 154 | 88 |
Goods producing | -- | -- | -- |
Natural resources and mining | 14 | -- | -- |
Agriculture, forestry, fishing and hunting | 13 | 14 | 8 |
Crop production | 11 | 13 | 7 |
Oilseed and grain farming | 9 | 9 | 5 |
Soybean farming | 1 | 4 | 2 |
Corn farming | 8 | 5 | 3 |
Greenhouse, nursery, and floriculture production | -- | 1 | 1 |
Food crops grown under cover | -- | 1 | 1 |
Mushroom production | -- | 1 | 1 |
Other crop farming | 1 | 2 | 1 |
Hay farming | -- | 2 | 1 |
Animal production and aquaculture | 1 | 1 | 1 |
Hog and pig farming | -- | 1 | 1 |
Hog and pig farming | -- | 1 | 1 |
Construction | 21 | 19 | 11 |
Construction | 21 | 19 | 11 |
Specialty trade contractors | 13 | 16 | 9 |
Foundation, structure, and building exterior contractors | 5 | 4 | 2 |
Building equipment contractors | 4 | 7 | 4 |
Plumbing, heating, and air-conditioning contractors | -- | 3 | 2 |
Manufacturing | 13 | 19 | 11 |
Manufacturing | 13 | 19 | 11 |
Food manufacturing | -- | 5 | 3 |
Other food manufacturing | -- | 2 | 1 |
Primary metal manufacturing | -- | 1 | 1 |
Alumina and aluminum production and processing | -- | 1 | 1 |
Alumina and aluminum production and processing | -- | 1 | 1 |
Aluminum sheet, plate, and foil manufacturing | -- | 1 | 1 |
Fabricated metal product manufacturing | -- | 4 | 2 |
Miscellaneous manufacturing | -- | 3 | 2 |
Service providing (3) | -- | -- | -- |
Trade, transportation, and utilities | 46 | 60 | 34 |
Wholesale trade | 9 | 11 | 6 |
Retail trade | 9 | 8 | 5 |
Food and beverage stores | 4 | 3 | 2 |
Grocery stores | 1 | 3 | 2 |
General merchandise stores | -- | 1 | 1 |
Department stores | -- | 1 | 1 |
Department stores | -- | 1 | 1 |
Transportation and warehousing | 27 | 41 | 23 |
Truck transportation | 18 | 25 | 14 |
General freight trucking | 14 | 19 | 11 |
General freight trucking, local | 4 | 8 | 5 |
General freight trucking, long-distance | 8 | 11 | 6 |
Specialized freight trucking | 4 | 6 | 3 |
Specialized freight (except used goods) trucking, long-distance | 4 | 6 | 3 |
Transit and ground passenger transportation | 2 | 3 | 2 |
Taxi and limousine service | 2 | 3 | 2 |
Support activities for transportation | 4 | 4 | 2 |
Couriers and messengers | -- | 1 | 1 |
Local messengers and local delivery | -- | 1 | 1 |
Local messengers and local delivery | -- | 1 | 1 |
Warehousing and storage | -- | 8 | 5 |
Warehousing and storage | -- | 8 | 5 |
General warehousing and storage | -- | 8 | 5 |
Information | -- | 4 | 2 |
Information | -- | 4 | 2 |
Financial activities | 4 | 5 | 3 |
Finance and insurance | -- | 1 | 1 |
Credit intermediation and related activities | -- | 1 | 1 |
Depository credit intermediation | -- | 1 | 1 |
Commercial banking | -- | 1 | 1 |
Real estate and rental and leasing | 4 | 4 | 2 |
Real estate | -- | 4 | 2 |
Professional and business services | 14 | 14 | 8 |
Professional, scientific, and technical services | 5 | 3 | 2 |
Professional, scientific, and technical services | 5 | 3 | 2 |
Other professional, scientific, and technical services | -- | 1 | 1 |
Photographic services | -- | 1 | 1 |
Photography studios, portrait | -- | 1 | 1 |
Administrative and support and waste management and remediation services | 9 | 11 | 6 |
Administrative and support services | 8 | 11 | 6 |
Educational and health services | 5 | -- | -- |
Health care and social assistance | 4 | 3 | 2 |
Ambulatory health care services | -- | 1 | 1 |
Home health care services | -- | 1 | 1 |
Home health care services | -- | 1 | 1 |
Leisure and hospitality | -- | 5 | 3 |
Accommodation and food services | 5 | 5 | 3 |
Other services, except public administration | -- | 8 | 5 |
Other services, except public administration | -- | 8 | 5 |
Repair and maintenance | -- | 5 | 3 |
Government (4) | 9 | 22 | 13 |
Federal government | 1 | 3 | 2 |
State government | -- | 4 | 2 |
Local government | 6 | 15 | 9 |
Footnotes: | |||
NOTE: Data for all years are final. Totals for major categories may include subcategories not shown separately. For complete information on how the data are coded and presented see our definitions page at https://www.bls.gov/iif/definitions/census-of-fatal-occupational-injuries-definitions.htm. Dashes indicate no data reported or data that do not meet publication criteria. CFOI fatal injury counts exclude illness-related deaths unless precipitated by an injury event. | |||
| Occupation (1) | 2020 | 2021 | |
|---|---|---|---|
| Number | Number | Percent | |
Total | 135 | 176 | 100 |
Management occupations | 6 | 17 | 10 |
Other management occupations | -- | 13 | 7 |
Farmers, ranchers, and other agricultural managers | -- | 10 | 6 |
Farmers, ranchers, and other agricultural managers | -- | 10 | 6 |
Arts, design, entertainment, sports, and media occupations | -- | 1 | 1 |
Protective service occupations | 8 | 20 | 11 |
Other protective service workers | 3 | 6 | 3 |
Security guards and gambling surveillance officers | -- | 6 | 3 |
Security guards | -- | 6 | 3 |
Food preparation and serving related occupations | -- | 3 | 2 |
Building and grounds cleaning and maintenance occupations | 9 | 10 | 6 |
Supervisors of building and grounds cleaning and maintenance workers | -- | 3 | 2 |
First-line supervisors of building and grounds cleaning and maintenance workers | -- | 3 | 2 |
Building cleaning and pest control workers | -- | 4 | 2 |
Building cleaning workers | -- | 4 | 2 |
Janitors and cleaners, except maids and housekeeping cleaners | -- | 4 | 2 |
Grounds maintenance workers | -- | 3 | 2 |
Grounds maintenance workers | -- | 3 | 2 |
Personal care and service occupations | -- | 2 | 1 |
Personal appearance workers | -- | 2 | 1 |
Barbers, hairdressers, hairstylists and cosmetologists | -- | 2 | 1 |
Barbers | -- | 2 | 1 |
Sales and related occupations | 9 | 9 | 5 |
Retail sales workers | -- | 1 | 1 |
Cashiers | -- | 1 | 1 |
Cashiers | -- | 1 | 1 |
Sales representatives, services | -- | 2 | 1 |
Sales representatives, wholesale and manufacturing | -- | 3 | 2 |
Sales representatives, wholesale and manufacturing | -- | 3 | 2 |
Office and administrative support occupations | 1 | 4 | 2 |
Financial clerks | -- | 1 | 1 |
Tellers | -- | 1 | 1 |
Tellers | -- | 1 | 1 |
Construction and extraction occupations | 20 | 16 | 9 |
Construction trades workers | 17 | 13 | 7 |
Construction laborers | 6 | 3 | 2 |
Construction laborers | 6 | 3 | 2 |
Pipelayers, plumbers, pipefitters, and steamfitters | -- | 2 | 1 |
Plumbers, pipefitters, and steamfitters | -- | 2 | 1 |
Installation, maintenance, and repair occupations | 15 | 14 | 8 |
Electrical and electronic equipment mechanics, installers, and repairers | -- | 4 | 2 |
Vehicle and mobile equipment mechanics, installers, and repairers | 6 | 6 | 3 |
Automotive technicians and repairers | -- | 4 | 2 |
Automotive service technicians and mechanics | -- | 4 | 2 |
Other installation, maintenance, and repair occupations | 7 | 4 | 2 |
Production occupations | 8 | 8 | 5 |
Metal workers and plastic workers | 6 | 4 | 2 |
Transportation and material moving occupations | 39 | 64 | 36 |
Supervisors of transportation and material moving workers | -- | 3 | 2 |
First-line supervisors of transportation and material moving workers | -- | 3 | 2 |
First-line supervisors of material-moving machine and vehicle operators | -- | 1 | 1 |
Motor vehicle operators | 31 | 42 | 24 |
Driver/sales workers and truck drivers | -- | 38 | 22 |
Driver/sales workers | -- | 3 | 2 |
Heavy and tractor-trailer truck drivers | -- | 30 | 17 |
Light truck drivers | -- | 5 | 3 |
Passenger vehicle drivers | -- | 4 | 2 |
Taxi drivers | -- | 3 | 2 |
Material moving workers | 5 | 19 | 11 |
Laborers and material movers | -- | 14 | 8 |
Footnotes: | |||
NOTE: Data for all years are final. Totals for major categories may include subcategories not shown separately. For complete information on how the data are coded and presented see our definitions page at https://www.bls.gov/iif/definitions/census-of-fatal-occupational-injuries-definitions.htm. Dashes indicate no data reported or data that do not meet publication criteria. CFOI fatal injury counts exclude illness-related deaths unless precipitated by an injury event. | |||
| Worker characteristics | 2020 | 2021 | |
|---|---|---|---|
| Number | Number | Percent | |
Total | 135 | 176 | 100 |
Employee status | |||
Wage and salary workers (1) | 109 | 140 | 80 |
Self-employed (2) | 26 | 36 | 20 |
Gender | |||
Men | 125 | 157 | 89 |
Women | 10 | 19 | 11 |
Age (3) | |||
20 to 24 years | 4 | 14 | 8 |
25 to 34 years | 25 | 31 | 18 |
35 to 44 years | 25 | 27 | 15 |
45 to 54 years | 23 | 31 | 18 |
55 to 64 years | 38 | 42 | 24 |
65 years and over | 18 | 31 | 18 |
Race or ethnic origin (4) | |||
White, non-Hispanic | 97 | 108 | 61 |
Black or African-American, non-Hispanic | 15 | 35 | 20 |
Hispanic or Latino | 18 | 27 | 15 |
Asian, non-Hispanic | 5 | 4 | 2 |
Footnotes: | |||
NOTE: Data for all years are final. Totals for major categories may include subcategories not shown separately. For complete information on how the data are coded and presented see our definitions page at https://www.bls.gov/iif/definitions/census-of-fatal-occupational-injuries-definitions.htm. Dashes indicate no data reported or data that do not meet publication criteria. CFOI fatal injury counts exclude illness-related deaths unless precipitated by an injury event. | |||
Last Modified Date: Friday, February 24, 2023