An official website of the United States government
An official website of the United States government
The .gov means it's official.
Federal government websites often end in .gov or .mil. Before sharing sensitive information,
make sure you're on a federal government site.
The site is secure.
The
https:// ensures that you are connecting to the official website and that any
information you provide is encrypted and transmitted securely.
23-177-CHI
Tuesday, February 28, 2023
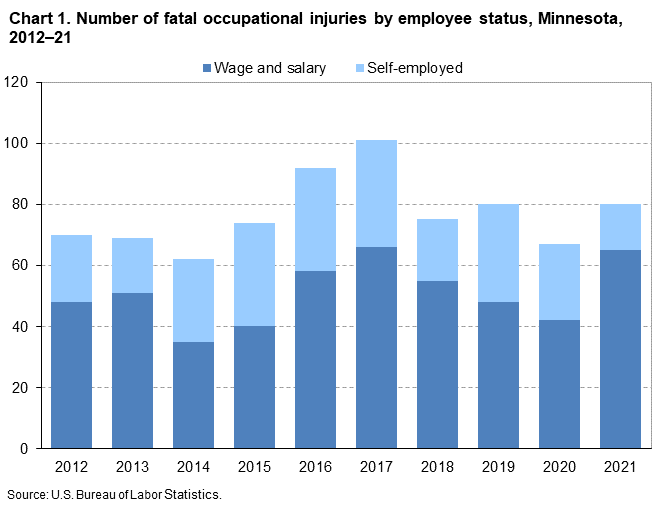
Fatal work injuries totaled 80 in 2021 for Minnesota, the U.S. Bureau of Labor Statistics reported today. Regional Commissioner Jason Palmer noted that the number of work-related fatalities in Minnesota was up from the previous year. (See chart 1.) Fatal occupational injuries in the state have ranged from a high of 113 in 1993 to a low of 60 in 2011.
Nationwide, a total of 5,190 fatal work injuries were recorded in 2021, a 9-percent increase from 4,764 in 2020, according to the results from the Census of Fatal Occupational Injuries (CFOI).
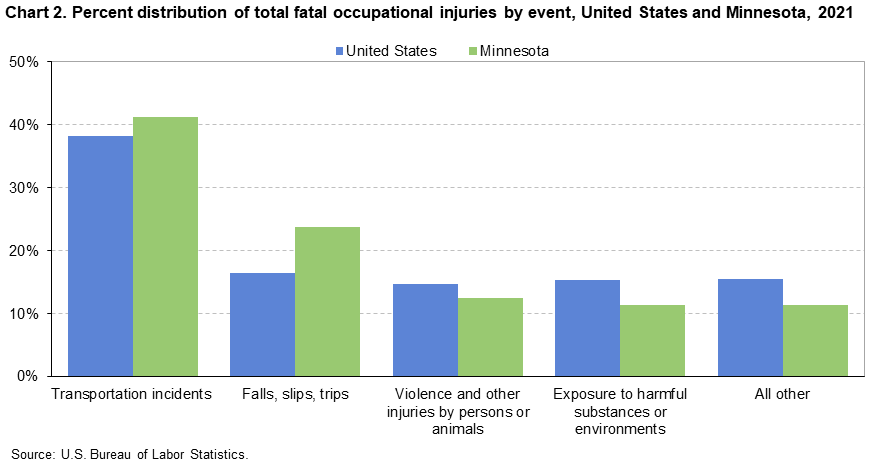
In Minnesota, transportation incidents resulted in 33 fatal work injuries, and violence and falls, slips, and trips, accounted for 19 fatalities. Together, these two major categories accounted for 65 percent of all fatal workplace injuries in the state. (See chart 2 and table 1.) Worker deaths from transportation incidents were up from 28 over the year, and worker fatalities due to falls, slips, and trips were up from 15.
Violence and other injuries by persons or animals were the third-most frequent fatal work event with 10 fatalities. Exposure to harmful substances or environments resulted in nine work-related deaths compared to seven in 2020.
Nationally, transportation incidents were the most frequent fatal event in 2021, accounting for 38 percent of fatal work injuries. Falls, slips, and trips was the second-most common fatal event (16 percent), followed by both exposure to harmful substances or environments and violence and other injuries by persons or animals (15 percent each) and contact with objects and equipment (14 percent).
The private construction industry sector had the highest number of fatalities in Minnesota with 18, up from 15 in the previous year. (See table 2.) Falls, slips, or trips resulted in 9 of the 18 fatalities in the industry. The specialty trade contractors subsector accounted for 11 of the 18 fatal workplace injuries in the construction industry.
The private agriculture, forestry, fishing, and hunting industry sector had 11 fatal workplace injuries, down from 14 in the previous year. The crop production subsector accounted for 5, or 45 percent, of the fatal injuries in this industry.
The private transportation and warehousing industry sector had 10 fatal workplace injuries, up from 5 in the previous year. The truck transportation subsector accounted for 8 of the fatal injuries in this industry.
OccupationThe transportation and material moving occupational group had the highest number of fatal workplace injuries with 25. (See table 3.) Heavy and tractor-trailer truck drivers accounted for 16 of the 25 fatalities among transportation and material moving workers. The construction and extraction occupational group had the second-highest number of fatal workplace injuries with 17. Construction trades workers suffered 11 of the work-related deaths within the construction and extraction group.
Additional highlightsMen accounted for 91 percent of the work-related fatalities in Minnesota, the same as the national share. (See table 4.) Transportation incidents made up 40 percent of the fatalities for men in Minnesota.
White non-Hispanics accounted for 81 percent of those who died from a workplace injury. Nationwide, this group accounted for 60 percent of work-related deaths.
Workers 25-54 years old accounted for 49 percent of the state’s work-related fatalities in 2021, compared to 57 percent of on-the-job fatalities nationally.
Of the 80 total fatal work injuries in Minnesota, 81 percent worked for wages and salaries; the remainder were self-employed. Transportation incidents were the most frequent fatal event for both groups of workers.
Background of the program. The Census of Fatal Occupational Injuries (CFOI), part of the Bureau of Labor Statistics (BLS) Occupational Safety and Health Statistics (OSHS) program, is a count of all fatalities resulting from workplace injuries occurring in the U.S. during the calendar year. The CFOI uses a variety of state, federal, and independent data sources to identify, verify, and describe fatal work injuries. This ensures counts are as complete and accurate as possible. For the 2021 national data, over 23,900 unique source documents were reviewed as part of the data collection process. For technical information and definitions for the CFOI, see the BLS Handbook of Methods at www.bls.gov/opub/hom/cfoi/home.htm and the CFOI definitions at www.bls.gov/iif/definitions/occupational-safety-and-health-definitions.htm.
Federal/State agency coverage. The CFOI includes data for all fatal work injuries, some of which may be outside the scope of other agencies or regulatory coverage. Comparisons between CFOI counts and those released by other agencies should account for the different coverage requirements and definitions used by each agency. For more information on the scope of CFOI, see www.bls.gov/iif/overview/cfoi-scope.htm and www.bls.gov/opub/hom/cfoi/concepts.htm.
Latency Cases. Latent fatal occupational injury cases occur when the date of injury differs from the date of death. In some cases, the death occurs in a different year than the occupational injury and are known as cross-year latent cases. In 2021, there were 197 cases nationally where this occurred, and 174 of these latent cases occurred more than 30 days prior to the start of 2021. For more information on latent cases, see www.bls.gov/opub/btn/volume-10/latency-in-fatal-occupational-injuries.htm.
Coronavirus (COVID-19) Pandemic and the Census of Fatal Occupational Injuries. CFOI reports fatal workplace injuries only. These may include fatal workplace injuries complicated by an illness such as COVID-19. Fatal workplace illnesses not precipitated by an injury are not in scope for CFOI. CFOI does not report any illness related information, including COVID-19. Additional information is available at www.bls.gov/covid19/effects-of-covid-19-on-workplace-injuries-and-illnesses-compensation-and-occupational-requirements.htm.
Acknowledgments. BLS thanks the Minnesota Department of Labor and Industry for their efforts in collecting accurate, comprehensive, and useful data on fatal work injuries. BLS also appreciates the efforts of all federal, state, local, and private sector entities that provided source documents used to identify fatal work injuries. Among these agencies are the Occupational Safety and Health Administration; the National Transportation Safety Board; the U.S. Coast Guard; the Mine Safety and Health Administration; the Office of Workers’ Compensation Programs (Federal Employees' Compensation and Longshore and Harbor Workers' Compensation divisions); the Federal Railroad Administration; the National Highway Traffic Safety Administration; state vital statistics registrars, coroners, and medical examiners; state departments of health, labor, and industrial relations and workers' compensation agencies; state and local police departments; and state farm bureaus.
Information in this release will be made available to individuals with sensory impairments upon request. Voice phone: (202) 691-5200; Telecommunications Relay Service: 7-1-1.
| Event or exposure (1) | 2020 | 2021 | |
|---|---|---|---|
| Number | Number | Percent | |
|
Total |
67 | 80 | 100 |
|
Violence and other injuries by persons or animals |
-- | 10 | 13 |
|
Transportation incidents |
28 | 33 | 41 |
|
Roadway incidents involving motorized land vehicle |
17 | 22 | 28 |
|
Roadway collision with other vehicle |
9 | 10 | 13 |
|
Roadway noncollision incident |
6 | 11 | 14 |
|
Jack-knifed or overturned, roadway |
6 | 7 | 9 |
|
Ran off roadway |
-- | 4 | 5 |
|
Nonroadway incident involving motorized land vehicles |
6 | 5 | 6 |
|
Nonroadway noncollision incident |
-- | 5 | 6 |
|
Jack-knifed or overturned, nonroadway |
-- | 3 | 4 |
|
Struck by shifting load during transport, nonroadway |
-- | 1 | 1 |
|
Falls, slips, trips |
15 | 19 | 24 |
|
Falls to lower level |
-- | 15 | 19 |
|
Other fall to lower level |
-- | 13 | 16 |
|
Other fall to lower level less than 6 feet |
-- | 3 | 4 |
|
Exposure to harmful substances or environments |
7 | 9 | 11 |
|
Exposure to electricity |
-- | 5 | 6 |
|
Direct exposure to electricity |
-- | 1 | 1 |
|
Direct exposure to electricity, greater than 220 volts |
-- | 1 | 1 |
|
Indirect exposure to electricity |
-- | 4 | 5 |
|
Footnotes: |
|||
|
NOTE: Data for all years are final. Totals for major categories may include subcategories not shown separately. For complete information on how the data are coded and presented see our definitions page at https://www.bls.gov/iif/definitions/census-of-fatal-occupational-injuries-definitions.htm. Dashes indicate no data reported or data that do not meet publication criteria. CFOI fatal injury counts exclude illness-related deaths unless precipitated by an injury event. |
|||
| Industry (1) | 2020 | 2021 | |
|---|---|---|---|
| Number | Number | Percent | |
|
Total |
67 | 80 | 100 |
|
Private industry (2) |
64 | 75 | 94 |
|
Goods producing |
-- | -- | -- |
|
Natural resources and mining |
14 | 11 | 14 |
|
Agriculture, forestry, fishing and hunting |
14 | 11 | 14 |
|
Crop production |
11 | 5 | 6 |
|
Animal production and aquaculture |
3 | 4 | 5 |
|
Construction |
15 | 18 | 23 |
|
Construction |
15 | 18 | 23 |
|
Specialty trade contractors |
11 | 11 | 14 |
|
Foundation, structure, and building exterior contractors |
-- | 4 | 5 |
|
Structural steel and precast concrete contractors |
-- | 1 | 1 |
|
Nonresidential structural steel and precast concrete contractors |
-- | 1 | 1 |
|
Other specialty trade contractors |
3 | 3 | 4 |
|
Manufacturing |
7 | 6 | 8 |
|
Manufacturing |
7 | 6 | 8 |
|
Food manufacturing |
4 | 2 | 3 |
|
Service providing (3) |
-- | -- | -- |
|
Trade, transportation, and utilities |
12 | 22 | 28 |
|
Utilities |
-- | 1 | 1 |
|
Utilities |
-- | 1 | 1 |
|
Electric power generation, transmission and distribution |
-- | 1 | 1 |
|
Electric power generation |
-- | 1 | 1 |
|
Fossil fuel electric power generation |
-- | 1 | 1 |
|
Wholesale trade |
3 | 5 | 6 |
|
Retail trade |
4 | 6 | 8 |
|
Building material and garden equipment and supplies dealers |
-- | 1 | 1 |
|
Building material and supplies dealers |
-- | 1 | 1 |
|
Home centers |
-- | 1 | 1 |
|
Nonstore retailers |
-- | 1 | 1 |
|
Direct selling establishments |
-- | 1 | 1 |
|
Transportation and warehousing |
5 | 10 | 13 |
|
Truck transportation |
-- | 8 | 10 |
|
Professional and business services |
9 | 7 | 9 |
|
Administrative and support and waste management and remediation services |
8 | 7 | 9 |
|
Administrative and support services |
7 | 4 | 5 |
|
Waste management and remediation services |
1 | 3 | 4 |
|
Educational and health services |
2 | 3 | 4 |
|
Health care and social assistance |
1 | 3 | 4 |
|
Ambulatory health care services |
-- | 2 | 3 |
|
Offices of physicians |
-- | 1 | 1 |
|
Offices of physicians |
-- | 1 | 1 |
|
Other ambulatory health care services |
-- | 1 | 1 |
|
Nursing and residential care facilities |
-- | 1 | 1 |
|
Residential intellectual and developmental disability, mental health, and substance abuse facilities |
-- | 1 | 1 |
|
Leisure and hospitality |
1 | -- | -- |
|
Arts, entertainment, and recreation |
-- | 2 | 3 |
|
Amusement, gambling, and recreation industries |
-- | 2 | 3 |
|
Other amusement and recreation industries |
-- | 2 | 3 |
|
Other services, except public administration |
-- | 3 | 4 |
|
Other services, except public administration |
-- | 3 | 4 |
|
Repair and maintenance |
-- | 3 | 4 |
|
Automotive repair and maintenance |
-- | 2 | 3 |
|
Automotive body, paint, interior, and glass repair |
-- | 2 | 3 |
|
Automotive body, paint, and interior repair and maintenance |
-- | 2 | 3 |
|
Government (4) |
3 | 5 | 6 |
|
Federal government |
3 | 1 | 1 |
|
State government |
-- | 2 | 3 |
|
Local government |
-- | 2 | 3 |
|
Footnotes: |
|||
|
NOTE: Data for all years are final. Totals for major categories may include subcategories not shown separately. For complete information on how the data are coded and presented see our definitions page at https://www.bls.gov/iif/definitions/census-of-fatal-occupational-injuries-definitions.htm. Dashes indicate no data reported or data that do not meet publication criteria. CFOI fatal injury counts exclude illness-related deaths unless precipitated by an injury event. |
|||
| Occupation (1) | 2020 | 2021 | |
|---|---|---|---|
| Number | Number | Percent | |
|
Total |
67 | 80 | 100 |
|
Management occupations |
10 | 5 | 6 |
|
Other management occupations |
10 | 5 | 6 |
|
Farmers, ranchers, and other agricultural managers |
10 | 5 | 6 |
|
Farmers, ranchers, and other agricultural managers |
10 | 5 | 6 |
|
Arts, design, entertainment, sports, and media occupations |
-- | 1 | 1 |
|
Entertainers and performers, sports and related workers |
-- | 1 | 1 |
|
Athletes, coaches, umpires, and related workers |
-- | 1 | 1 |
|
Healthcare practitioners and technical occupations |
1 | 1 | 1 |
|
Health technologists and technicians |
-- | 1 | 1 |
|
Emergency medical technicians and paramedics |
-- | 1 | 1 |
|
Paramedics |
-- | 1 | 1 |
|
Healthcare support occupations |
-- | 1 | 1 |
|
Other healthcare support occupations |
-- | 1 | 1 |
|
Miscellaneous healthcare support occupations |
-- | 1 | 1 |
|
Building and grounds cleaning and maintenance occupations |
3 | 4 | 5 |
|
Supervisors of building and grounds cleaning and maintenance workers |
-- | 1 | 1 |
|
First-line supervisors of building and grounds cleaning and maintenance workers |
-- | 1 | 1 |
|
First-line supervisors of landscaping, lawn service, and groundskeeping workers |
-- | 1 | 1 |
|
Grounds maintenance workers |
-- | 3 | 4 |
|
Grounds maintenance workers |
-- | 3 | 4 |
|
Farming, fishing, and forestry occupations |
4 | 6 | 8 |
|
Construction and extraction occupations |
16 | 17 | 21 |
|
Construction trades workers |
15 | 11 | 14 |
|
Electricians |
-- | 2 | 3 |
|
Electricians |
-- | 2 | 3 |
|
Installation, maintenance, and repair occupations |
4 | 7 | 9 |
|
Other installation, maintenance, and repair occupations |
-- | 4 | 5 |
|
Industrial machinery installation, repair, and maintenance workers |
-- | 1 | 1 |
|
Millwrights |
-- | 1 | 1 |
|
Production occupations |
4 | 3 | 4 |
|
Transportation and material moving occupations |
19 | 25 | 31 |
|
Motor vehicle operators |
14 | 20 | 25 |
|
Driver/sales workers and truck drivers |
-- | 19 | 24 |
|
Heavy and tractor-trailer truck drivers |
-- | 16 | 20 |
|
Footnotes: |
|||
|
NOTE: Data for all years are final. Totals for major categories may include subcategories not shown separately. For complete information on how the data are coded and presented see our definitions page at https://www.bls.gov/iif/definitions/census-of-fatal-occupational-injuries-definitions.htm. Dashes indicate no data reported or data that do not meet publication criteria. CFOI fatal injury counts exclude illness-related deaths unless precipitated by an injury event. |
|||
| Worker characteristics | 2020 | 2021 | |
|---|---|---|---|
| Number | Number | Percent | |
|
Total |
67 | 80 | 100 |
|
Employee status |
|||
|
Wage and salary workers (1) |
42 | 65 | 81 |
|
Self-employed (2) |
25 | 15 | 19 |
|
Gender |
|||
|
Men |
61 | 73 | 91 |
|
Women |
6 | 7 | 9 |
|
Age (3) |
|||
|
18 to 19 years |
-- | 2 | 3 |
|
20 to 24 years |
-- | 7 | 9 |
|
25 to 34 years |
10 | 5 | 6 |
|
35 to 44 years |
8 | 20 | 25 |
|
45 to 54 years |
9 | 14 | 18 |
|
55 to 64 years |
19 | 23 | 29 |
|
65 years and over |
16 | 9 | 11 |
|
Race or ethnic origin (4) |
|||
|
White, non-Hispanic |
58 | 65 | 81 |
|
Black or African-American, non-Hispanic |
-- | 7 | 9 |
|
Hispanic or Latino |
4 | 3 | 4 |
|
Footnotes: |
|||
|
NOTE: Data for all years are final. Totals for major categories may include subcategories not shown separately. For complete information on how the data are coded and presented see our definitions page at https://www.bls.gov/iif/definitions/census-of-fatal-occupational-injuries-definitions.htm. Dashes indicate no data reported or data that do not meet publication criteria. CFOI fatal injury counts exclude illness-related deaths unless precipitated by an injury event. |
|||
Last Modified Date: Tuesday, February 28, 2023