An official website of the United States government
An official website of the United States government
The .gov means it's official.
Federal government websites often end in .gov or .mil. Before sharing sensitive information,
make sure you're on a federal government site.
The site is secure.
The
https:// ensures that you are connecting to the official website and that any
information you provide is encrypted and transmitted securely.
23-135-CHI
Thursday, February 23, 2023
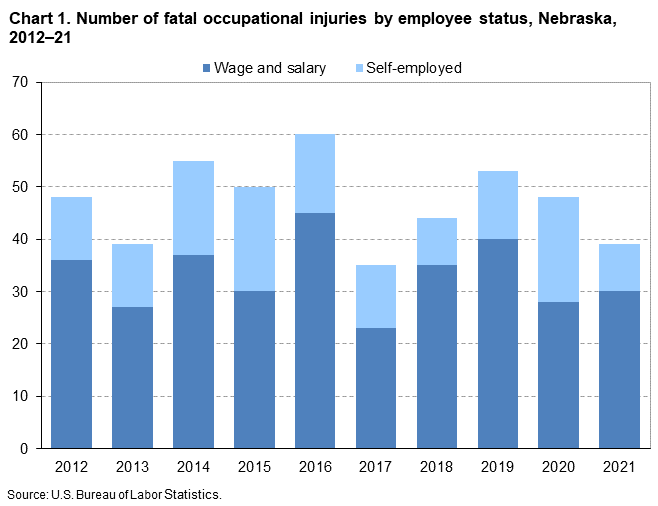
Fatal work injuries totaled 39 in 2021 for Nebraska, the U.S. Bureau of Labor Statistics reported today. Regional Commissioner Jason Palmer noted that the number of work-related fatalities in Nebraska was down from the previous year. (See chart 1.) Fatal occupational injuries in the state have ranged from a high of 83, occurring in 1994 and 2002, to a low of 35 in 2017.
Nationwide, a total of 5,190 fatal work injuries were recorded in 2021, a 9-percent increase from 4,764 in 2020, according to the results from the Census of Fatal Occupational Injuries (CFOI).
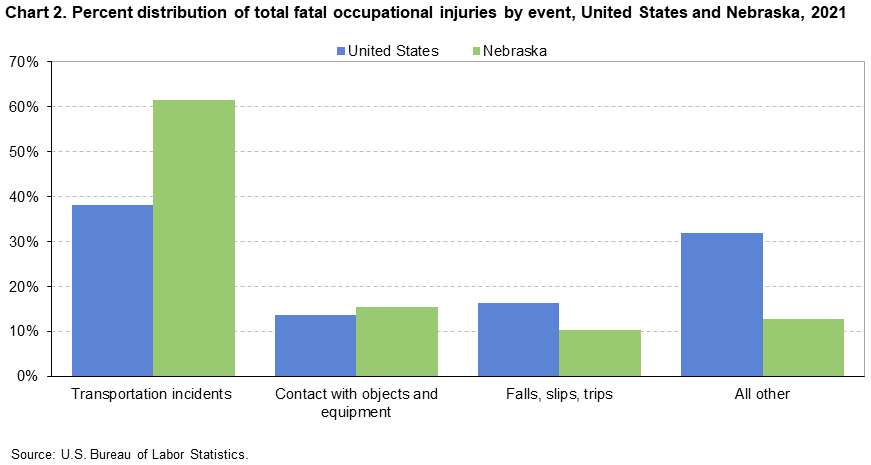
In Nebraska, transportation incidents resulted in 24 fatal work injuries, accounting for 62 percent of all fatal workplace injuries in the state. (See chart 2 and table 1.) Worker deaths from transportation incidents were down from 26 over the year. Contact with objects or equipment was the second-most frequent fatal work event with 6 fatalities, down from 10 in the prior year. Falls, slips, or trips resulted in four work-related deaths.
Nationally, transportation incidents were the most frequent fatal event in 2021, accounting for 38 percent of fatal work injuries. Falls, slips, and trips was the second-most common fatal event (16 percent), followed by both exposure to harmful substances or environments and violence and other injuries by persons or animals (15 percent each) and contact with objects and equipment (14 percent).
The private agriculture, forestry, fishing, and hunting industry sector had 10 fatalities in Nebraska, down from 20 in the previous year. (See table 2.) Transportation incidents resulted in 6 of the 10 fatalities in the industry. The cattle ranching and farming industry group accounted for 4 of the 10 fatal workplace injuries in the agriculture, forestry, fishing, and hunting industry.
The private transportation and warehousing industry sector had 10 fatal workplace injuries, the same as the previous year. The truck transportation subsector accounted for eight, or 80 percent, of the fatal injuries in this industry.
OccupationThe transportation and material moving occupational group had the highest number of fatal workplace injuries with 16, up from 14 the previous year. (See table 3.) The management occupational group and the construction and extraction occupational group had the second-highest number of fatal workplace injuries with six each. Farmers, ranchers, and other agricultural managers suffered five of the work-related deaths within the management occupational group. Construction trades workers accounted for the six construction and extraction fatalities.
Additional highlightsBackground of the program. The Census of Fatal Occupational Injuries (CFOI), part of the Bureau of Labor Statistics (BLS) Occupational Safety and Health Statistics (OSHS) program, is a count of all fatalities resulting from workplace injuries occurring in the U.S. during the calendar year. The CFOI uses a variety of state, federal, and independent data sources to identify, verify, and describe fatal work injuries. This ensures counts are as complete and accurate as possible. For the 2021 national data, over 23,900 unique source documents were reviewed as part of the data collection process. For technical information and definitions for the CFOI, see the BLS Handbook of Methods at www.bls.gov/opub/hom/cfoi/home.htm and the CFOI definitions at www.bls.gov/iif/definitions/occupational-safety-and-health-definitions.htm.
Federal/State agency coverage. The CFOI includes data for all fatal work injuries, some of which may be outside the scope of other agencies or regulatory coverage. Comparisons between CFOI counts and those released by other agencies should account for the different coverage requirements and definitions used by each agency. For more information on the scope of CFOI, see www.bls.gov/iif/overview/cfoi-scope.htm and www.bls.gov/opub/hom/cfoi/concepts.htm.
Latency Cases. Latent fatal occupational injury cases occur when the date of injury differs from the date of death. In some cases, the death occurs in a different year than the occupational injury and are known as cross-year latent cases. In 2021, there were 197 cases nationally where this occurred, and 174 of these latent cases occurred more than 30 days prior to the start of 2021. For more information on latent cases, see www.bls.gov/opub/btn/volume-10/latency-in-fatal-occupational-injuries.htm.
Coronavirus (COVID-19) Pandemic and the Census of Fatal Occupational Injuries. CFOI reports fatal workplace injuries only. These may include fatal workplace injuries complicated by an illness such as COVID-19. Fatal workplace illnesses not precipitated by an injury are not in scope for CFOI. CFOI does not report any illness related information, including COVID-19. Additional information is available at www.bls.gov/covid19/effects-of-covid-19-on-workplace-injuries-and-illnesses-compensation-and-occupational-requirements.htm.
Acknowledgments. BLS thanks the Nebraska Workers' Compensation Court for their efforts in collecting accurate, comprehensive, and useful data on fatal work injuries. BLS also appreciates the efforts of all federal, state, local, and private sector entities that provided source documents used to identify fatal work injuries. Among these agencies are the Occupational Safety and Health Administration; the National Transportation Safety Board; the U.S. Coast Guard; the Mine Safety and Health Administration; the Office of Workers’ Compensation Programs (Federal Employees' Compensation and Longshore and Harbor Workers' Compensation divisions); the Federal Railroad Administration; the National Highway Traffic Safety Administration; state vital statistics registrars, coroners, and medical examiners; state departments of health, labor, and industrial relations and workers' compensation agencies; state and local police departments; and state farm bureaus.
Information in this release will be made available to individuals with sensory impairments upon request. Voice phone: (202) 691-5200; Telecommunications Relay Service: 7-1-1.
| Event or exposure (1) | 2020 | 2021 | |
|---|---|---|---|
| Number | Number | Percent | |
Total | 48 | 39 | 100 |
Transportation incidents | 26 | 24 | 62 |
Rail vehicle incidents | -- | 1 | 3 |
Collision between rail vehicle and another vehicle | -- | 1 | 3 |
Collision between rail and roadway vehicles | -- | 1 | 3 |
Roadway incidents involving motorized land vehicle | 18 | 20 | 51 |
Roadway collision with other vehicle | 12 | 15 | 38 |
Roadway collision--moving in same direction | 1 | 2 | 5 |
Roadway collision--moving in opposite directions, oncoming | 7 | 6 | 15 |
Roadway collision--moving perpendicularly | 4 | 6 | 15 |
Roadway collision--moving and standing vehicle in roadway | -- | 1 | 3 |
Nonroadway incident involving motorized land vehicles | 3 | 3 | 8 |
Falls, slips, trips | -- | 4 | 10 |
Falls to lower level | -- | 4 | 10 |
Fall through surface or existing opening | -- | 1 | 3 |
Fall through surface or existing opening 11 to 15 feet | -- | 1 | 3 |
Contact with objects and equipment | 10 | 6 | 15 |
Struck by object or equipment | 8 | 4 | 10 |
Struck by powered vehicle--nontransport | 6 | 1 | 3 |
Caught between rolling powered vehicle and other object | -- | 1 | 3 |
Struck by falling object or equipment--other than powered vehicle | -- | 3 | 8 |
Struck by object falling from vehicle or machinery--other than vehicle part | -- | 1 | 3 |
Caught in or compressed by equipment or objects | -- | 1 | 3 |
Compressed or pinched by shifting objects or equipment | -- | 1 | 3 |
Struck, caught, or crushed in collapsing structure, equipment, or material | -- | 1 | 3 |
Struck, caught, or crushed in other collapsing structure or equipment | -- | 1 | 3 |
Footnotes: | |||
NOTE: Data for all years are final. Totals for major categories may include subcategories not shown separately. For complete information on how the data are coded and presented see our definitions page at https://www.bls.gov/iif/definitions/census-of-fatal-occupational-injuries-definitions.htm. Dashes indicate no data reported or data that do not meet publication criteria. CFOI fatal injury counts exclude illness-related deaths unless precipitated by an injury event. | |||
| Industry (1) | 2020 | 2021 | |
|---|---|---|---|
| Number | Number | Percent | |
Total | 48 | 39 | 100 |
Private industry (2) | 44 | 36 | 92 |
Goods producing | -- | -- | -- |
Natural resources and mining | 20 | 11 | 28 |
Agriculture, forestry, fishing and hunting | 20 | 10 | 26 |
Animal production and aquaculture | 9 | 4 | 10 |
Cattle ranching and farming | 9 | 4 | 10 |
Beef cattle ranching and farming, including feedlots | 9 | 4 | 10 |
Mining, quarrying, and oil and gas extraction (3) | -- | 1 | 3 |
Mining (except oil and gas) | -- | 1 | 3 |
Nonmetallic mineral mining and quarrying | -- | 1 | 3 |
Sand, gravel, clay, and ceramic and refractory minerals mining and quarrying | -- | 1 | 3 |
Construction sand and gravel mining | -- | 1 | 3 |
Construction | 4 | 8 | 21 |
Construction | 4 | 8 | 21 |
Construction of buildings | -- | 4 | 10 |
Residential building construction | -- | 1 | 3 |
Residential building construction | -- | 1 | 3 |
Residential remodelers | -- | 1 | 3 |
Nonresidential building construction | -- | 1 | 3 |
Commercial and institutional building construction | -- | 1 | 3 |
Manufacturing | 1 | 1 | 3 |
Manufacturing | 1 | 1 | 3 |
Plastics and rubber products manufacturing | -- | 1 | 3 |
Service providing (4) | -- | -- | -- |
Trade, transportation, and utilities | -- | -- | -- |
Wholesale trade | 1 | 3 | 8 |
Transportation and warehousing | 10 | 10 | 26 |
Truck transportation | 7 | 8 | 21 |
General freight trucking | 4 | 5 | 13 |
General freight trucking, local | 1 | 2 | 5 |
General freight trucking, long-distance | 3 | 3 | 8 |
Specialized freight trucking | 3 | 3 | 8 |
Used household and office goods moving | -- | 1 | 3 |
Specialized freight (except used goods) trucking, local | 3 | 2 | 5 |
Transit and ground passenger transportation | -- | 1 | 3 |
Taxi and limousine service | -- | 1 | 3 |
Couriers and messengers | -- | 1 | 3 |
Couriers and express delivery services | -- | 1 | 3 |
Couriers and express delivery services | -- | 1 | 3 |
Government (5) | 4 | 3 | 8 |
Federal government | -- | 2 | 5 |
State government | -- | 1 | 3 |
Footnotes: | |||
NOTE: Data for all years are final. Totals for major categories may include subcategories not shown separately. For complete information on how the data are coded and presented see our definitions page at https://www.bls.gov/iif/definitions/census-of-fatal-occupational-injuries-definitions.htm. Dashes indicate no data reported or data that do not meet publication criteria. CFOI fatal injury counts exclude illness-related deaths unless precipitated by an injury event. | |||
| Occupation (1) | 2020 | 2021 | |
|---|---|---|---|
| Number | Number | Percent | |
Total | 48 | 39 | 100 |
Management occupations | 17 | 6 | 15 |
Other management occupations | 17 | 6 | 15 |
Farmers, ranchers, and other agricultural managers | 17 | 5 | 13 |
Farmers, ranchers, and other agricultural managers | 17 | 5 | 13 |
Construction and extraction occupations | 5 | 6 | 15 |
Construction trades workers | 4 | 6 | 15 |
Installation, maintenance, and repair occupations | 2 | 3 | 8 |
Transportation and material moving occupations | 14 | 16 | 41 |
Footnotes: | |||
NOTE: Data for all years are final. Totals for major categories may include subcategories not shown separately. For complete information on how the data are coded and presented see our definitions page at https://www.bls.gov/iif/definitions/census-of-fatal-occupational-injuries-definitions.htm. Dashes indicate no data reported or data that do not meet publication criteria. CFOI fatal injury counts exclude illness-related deaths unless precipitated by an injury event. | |||
| Worker characteristics | 2020 | 2021 | |
|---|---|---|---|
| Number | Number | Percent | |
Total | 48 | 39 | 100 |
Employee status | |||
Wage and salary workers (1) | 28 | 30 | 77 |
Self-employed (2) | 20 | 9 | 23 |
Gender | |||
Men | 46 | -- | -- |
Women | 2 | -- | -- |
Age (3) | |||
20 to 24 years | 2 | 2 | 5 |
25 to 34 years | 8 | 7 | 18 |
35 to 44 years | 6 | 8 | 21 |
45 to 54 years | 3 | 9 | 23 |
55 to 64 years | 12 | 7 | 18 |
65 years and over | 17 | 5 | 13 |
Race or ethnic origin (4) | |||
White, non-Hispanic | 42 | 26 | 67 |
Black or African-American, non-Hispanic | -- | -- | -- |
Hispanic or Latino | -- | 9 | 23 |
Footnotes: | |||
NOTE: Data for all years are final. Totals for major categories may include subcategories not shown separately. For complete information on how the data are coded and presented see our definitions page at https://www.bls.gov/iif/definitions/census-of-fatal-occupational-injuries-definitions.htm. Dashes indicate no data reported or data that do not meet publication criteria. CFOI fatal injury counts exclude illness-related deaths unless precipitated by an injury event. | |||
Last Modified Date: Thursday, February 23, 2023