An official website of the United States government
An official website of the United States government
The .gov means it's official.
Federal government websites often end in .gov or .mil. Before sharing sensitive information,
make sure you're on a federal government site.
The site is secure.
The
https:// ensures that you are connecting to the official website and that any
information you provide is encrypted and transmitted securely.
24-2527-CHI
Thursday, December 19, 2024
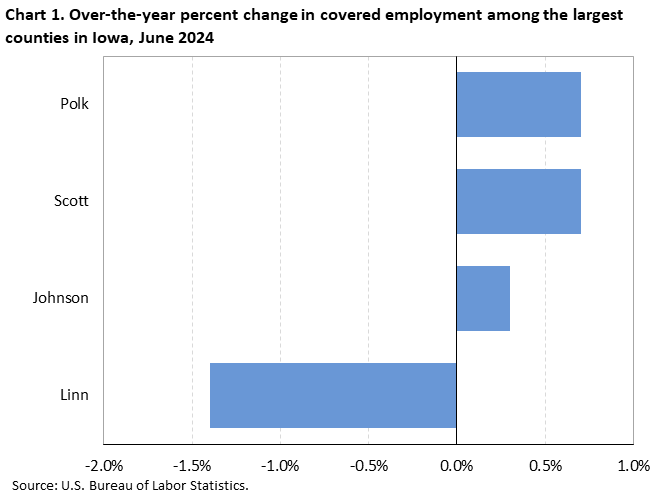
Employment rose in 3 of the 4 largest counties in Iowa from June 2023 to June 2024, the U.S. Bureau of Labor Statistics reported today. (Large counties are the 369 U.S. counties or county equivalents with annual average employment levels of 75,000 or more in 2023.) Regional Commissioner Jason Palmer noted that Polk County and Scott County had the largest over-the-year increases in employment at 0.7 percent each. (See chart 1 and table 1.)
National employment increased 0.8 percent over the year, with 259 of the 355 largest U.S. counties with published data reporting gains. Kings, NY, had the largest over-the-year increase in employment, with a gain of 4.0 percent. Elkhart, IN, had the largest over-the-year percentage decrease in employment (-3.0 percent).
Among the four largest counties in Iowa, employment was highest in Polk (322,000) in June 2024. Within Polk County’s private industry, health care and social assistance accounted for the largest employment. Together, the four largest Iowa counties accounted for 39.4 percent of total covered employment within the state. Nationwide, the 369 largest counties comprised 73.1 percent of total covered employment in the United States.
Employment and wage levels (but not over-the-year changes) are also available for the 95 counties in Iowa with employment below 75,000. Wage levels in the 95 smaller counties were below the national average of $1,390 in the second quarter of 2024. (See table 2.)
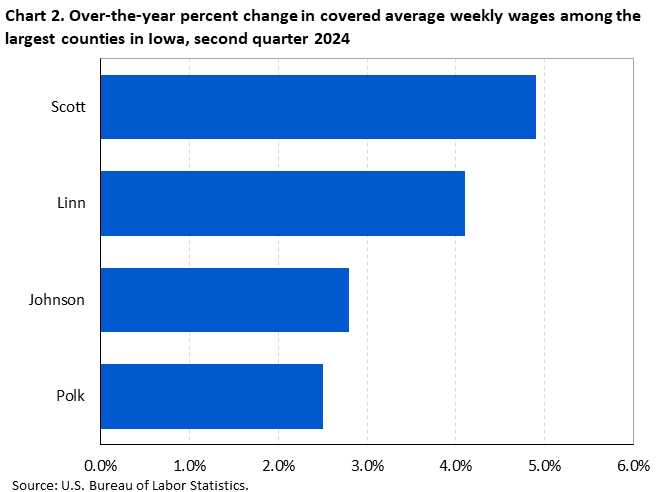
Large county wage changesAll four large Iowa counties reported average weekly wage gains from the second quarter of 2023 to the second quarter of 2024. (See chart 2.) Scott County had the largest gain (+4.9 percent), followed by Linn County (+4.1 percent). Over-the-year wage gains for Johnson County and Polk County were 2.8 percent and 2.5 percent, respectively.
Nationwide, wages increased by 4.4 percent over the year. Among the 351 largest counties in the United States with published data, 348 had over-the-year wage increases. Hamilton, IN, had the largest percentage wage increase (+33.4 percent). Essex, MA, had the largest over-the-year percentage decrease (-2.1 percent).
Large county average weekly wagesWeekly wages in the four largest counties in Iowa were below the national average of $1,390 in the second quarter of 2024. Average weekly wages in these counties ranged from $1,298 in Polk County to $1,128 in Scott County.
Among the 360 largest U.S. counties with published data, 87 reported average weekly wages above the U.S. average in the second quarter of 2024. Santa Clara, CA, had the highest average weekly wage ($3,632). Average weekly wages were below the national average in the remaining 273 counties. Hidalgo, TX, had the lowest average weekly wage ($820).
Smaller county average weekly wagesAll 95 smaller counties in Iowa—those with employment below 75,000— reported an average weekly wage below the national average. Dallas County ($1,312) reported the highest average weekly wage in the state, while Decatur County ($787) reported the lowest.
When all 99 counties in Iowa were considered, 18 reported average weekly wages of less than $900, 21 registered wages from $900 to $949, 27 had average weekly wages from $950 to $999, 14 had wages of $1,000 to $1,049, and 19 registered average weekly wages of $1,050 or higher. (See map 1.)
QCEW data for states have been included in this release in table 3. For additional information about quarterly employment and wages data, please read the Technical Note for the County Employment and Wages News Release or visit the Quarterly Census of Employment and Wages website.
Employment and Wages Annual Averages Online features comprehensive information by detailed industry on establishments, employment, and wages for the nation and all states. This publication is typically published in September of the following year of the reference period or shortly after the QCEW first quarter full data update.
Information in this release will be made available to individuals with sensory impairments upon request. Voice phone: (202) 691-5200; Telecommunications Relay Service: 7-1-1.
The County Employment and Wages release for the third quarter 2024 is scheduled to be released on Wednesday, February 19, 2025.
The County Employment and Wages full data update for the third quarter 2024 is scheduled to be released on Wednesday, March 5, 2025.
| Area | Establishments, second quarter (thousands) | Employment | Average weekly wage (1) | |||||
|---|---|---|---|---|---|---|---|---|
| June 2024 (thousands) | Percent change, June 2023–24 (2) | National ranking by percent change (3) | Second quarter 2024 ($) | National ranking by level (3) | Percent change, second quarter 2023–24 (2) | National ranking by percent change (3) | ||
United States (4) | 12,238.2 | 155,710.2 | 0.8 | -- | 1,390 | -- | 4.4 | -- |
Iowa | 111.3 | 1,588.0 | 0.2 | -- | 1,118 | 45 | 3.3 | 45 |
Johnson | 5.1 | 83.7 | 0.3 | 222 | 1,198 | 203 | 2.8 | 286 |
Linn | 7.7 | 127.6 | -1.4 | 351 | 1,247 | 167 | 4.1 | 157 |
Polk | 20.4 | 322.0 | 0.7 | 165 | 1,298 | 139 | 2.5 | 302 |
Scott | 6.2 | 91.7 | 0.7 | 165 | 1,128 | 271 | 4.9 | 83 |
Footnotes: | ||||||||
Note: Data are preliminary. Covered employment and wages includes workers covered by Unemployment Insurance (UI) and Unemployment Compensation for Federal Employees (UCFE) programs. | ||||||||
| Area | Establishments | Employment June 2024 | Average weekly wage ($) (1) |
|---|---|---|---|
United States (2) | 12,238,175 | 155,710,239 | 1,390 |
Iowa | 111,274 | 1,588,010 | 1,118 |
Adair | 327 | 3,162 | 959 |
Adams | 152 | 1,227 | 897 |
Allamakee | 476 | 4,972 | 841 |
Appanoose | 409 | 4,790 | 858 |
Audubon | 239 | 1,866 | 959 |
Benton | 712 | 6,245 | 1,095 |
Black Hawk | 3,917 | 71,862 | 1,061 |
Boone | 750 | 9,253 | 1,010 |
Bremer | 740 | 9,804 | 954 |
Buchanan | 637 | 6,891 | 910 |
Buena Vista | 612 | 10,782 | 988 |
Butler | 418 | 3,840 | 978 |
Calhoun | 326 | 2,912 | 908 |
Carroll | 971 | 11,207 | 927 |
Cass | 539 | 6,030 | 886 |
Cedar | 587 | 5,386 | 939 |
Cerro Gordo | 1,673 | 23,718 | 1,015 |
Cherokee | 450 | 4,987 | 959 |
Chickasaw | 431 | 5,269 | 980 |
Clarke | 249 | 4,755 | 941 |
Clay | 747 | 8,794 | 970 |
Clayton | 606 | 6,506 | 1,004 |
Clinton | 1,486 | 19,642 | 996 |
Crawford | 518 | 6,708 | 963 |
Dallas | 3,548 | 56,671 | 1,312 |
Davis | 260 | 2,209 | 926 |
Decatur | 224 | 2,208 | 787 |
Delaware | 608 | 6,901 | 998 |
Des Moines | 1,402 | 20,022 | 1,006 |
Dickinson | 958 | 11,314 | 840 |
Dubuque | 3,704 | 59,387 | 1,065 |
Emmet | 329 | 3,363 | 909 |
Fayette | 675 | 7,122 | 918 |
Floyd | 478 | 5,854 | 1,018 |
Franklin | 363 | 4,194 | 961 |
Fremont | 282 | 2,186 | 884 |
Greene | 312 | 3,245 | 1,036 |
Grundy | 387 | 4,354 | 1,051 |
Guthrie | 395 | 3,419 | 1,004 |
Hamilton | 487 | 5,894 | 965 |
Hancock | 382 | 6,165 | 1,112 |
Hardin | 650 | 6,659 | 985 |
Harrison | 467 | 4,113 | 928 |
Henry | 640 | 8,184 | 977 |
Howard | 340 | 4,479 | 913 |
Humboldt | 367 | 3,985 | 988 |
Ida | 297 | 3,709 | 1,063 |
Iowa | 698 | 9,236 | 901 |
Jackson | 671 | 6,108 | 827 |
Jasper | 987 | 11,019 | 920 |
Jefferson | 799 | 7,230 | 988 |
Johnson | 5,094 | 83,668 | 1,198 |
Jones | 665 | 6,533 | 919 |
Keokuk | 314 | 2,329 | 911 |
Kossuth | 646 | 6,697 | 967 |
Lee | 1,070 | 13,919 | 1,083 |
Linn | 7,711 | 127,580 | 1,247 |
Louisa | 281 | 3,954 | 971 |
Lucas | 252 | 3,405 | 946 |
Lyon | 550 | 5,070 | 857 |
Madison | 569 | 4,435 | 907 |
Mahaska | 628 | 7,865 | 983 |
Marion | 1,057 | 20,454 | 1,134 |
Marshall | 1,017 | 15,969 | 1,015 |
Mills | 453 | 3,627 | 1,029 |
Mitchell | 373 | 4,014 | 1,007 |
Monona | 298 | 2,642 | 833 |
Monroe | 254 | 3,788 | 1,234 |
Montgomery | 383 | 4,154 | 954 |
Muscatine | 1,224 | 21,819 | 1,161 |
O'Brien | 628 | 6,814 | 876 |
Osceola | 272 | 2,758 | 906 |
Page | 487 | 6,517 | 913 |
Palo Alto | 336 | 3,754 | 856 |
Plymouth | 872 | 12,152 | 1,124 |
Pocahontas | 267 | 2,698 | 979 |
Polk | 20,433 | 322,047 | 1,298 |
Pottawattamie | 2,719 | 41,443 | 1,036 |
Poweshiek | 705 | 9,850 | 1,056 |
Ringgold | 184 | 1,442 | 874 |
Sac | 391 | 3,019 | 947 |
Scott | 6,197 | 91,748 | 1,128 |
Shelby | 447 | 5,585 | 930 |
Sioux | 1,579 | 23,476 | 1,009 |
Story | 3,045 | 47,130 | 1,156 |
Tama | 441 | 5,544 | 894 |
Taylor | 190 | 2,052 | 956 |
Union | 456 | 6,110 | 931 |
Van Buren | 223 | 1,956 | 839 |
Wapello | 886 | 15,577 | 973 |
Warren | 1,401 | 13,441 | 964 |
Washington | 851 | 8,769 | 851 |
Wayne | 183 | 2,140 | 951 |
Webster | 1,201 | 17,721 | 1,045 |
Winnebago | 394 | 3,906 | 866 |
Winneshiek | 763 | 10,885 | 956 |
Woodbury | 3,304 | 51,336 | 1,014 |
Worth | 227 | 2,390 | 850 |
Wright | 466 | 6,295 | 1,093 |
Footnotes: | |||
Note: Data are preliminary. Covered employment and wages includes workers covered by Unemployment Insurance (UI) and Unemployment Compensation for Federal Employees (UCFE) programs. | |||
| State | Establishments, second quarter (thousands) | Employment | Average weekly wage (1) | ||||
|---|---|---|---|---|---|---|---|
| June 2024 (thousands) | Percent change, June 2023–24 | Second quarter 2024 ($) | National ranking by level | Percent change, second quarter 2023–24 | National ranking by percent change | ||
United States (2) | 12,238.2 | 155,710.2 | 0.8 | 1,390 | -- | 4.4 | -- |
Alabama | 162.9 | 2,111.1 | 1.2 | 1,150 | 36 | 3.9 | 35 |
Alaska | 25.4 | 345.9 | 0.8 | 1,345 | 15 | 4.5 | 17 |
Arizona | 221.3 | 3,137.3 | 1.1 | 1,324 | 18 | 4.6 | 16 |
Arkansas | 101.7 | 1,299.9 | 1.0 | 1,074 | 49 | 4.1 | 30 |
California | 1,878.6 | 18,193.5 | 0.4 | 1,697 | 4 | 4.4 | 20 |
Colorado | 268.9 | 2,909.4 | -0.2 | 1,487 | 8 | 4.2 | 25 |
Connecticut | 151.4 | 1,702.2 | 0.4 | 1,569 | 6 | 3.8 | 37 |
Delaware | 43.8 | 481.0 | 0.9 | 1,322 | 19 | 5.4 | 6 |
District of Columbia | 52.3 | 764.0 | 0.1 | 2,283 | 1 | 4.2 | 25 |
Florida | 903.5 | 9,700.1 | 1.4 | 1,278 | 21 | 3.6 | 43 |
Georgia | 392.2 | 4,867.7 | 1.2 | 1,297 | 20 | 4.2 | 25 |
Hawaii | 59.6 | 640.9 | 0.8 | 1,273 | 22 | 5.8 | 3 |
Idaho | 101.0 | 867.3 | 1.2 | 1,096 | 48 | 5.6 | 4 |
Illinois | 410.2 | 6,115.5 | 0.0 | 1,401 | 12 | 3.4 | 44 |
Indiana | 192.5 | 3,187.3 | 0.4 | 1,171 | 33 | 6.4 | 2 |
Iowa | 111.3 | 1,588.0 | 0.2 | 1,118 | 45 | 3.3 | 45 |
Kansas | 100.9 | 1,435.8 | 0.5 | 1,124 | 43 | 4.0 | 31 |
Kentucky | 157.1 | 1,995.9 | 1.0 | 1,146 | 38 | 4.3 | 23 |
Louisiana | 155.9 | 1,904.3 | 0.6 | 1,144 | 40 | 4.7 | 12 |
Maine | 65.7 | 666.1 | 1.1 | 1,167 | 35 | 4.2 | 25 |
Maryland | 210.5 | 2,778.5 | 1.5 | 1,454 | 9 | 3.8 | 37 |
Massachusetts | 287.6 | 3,708.1 | 0.2 | 1,758 | 3 | 5.0 | 8 |
Michigan | 345.1 | 4,480.5 | 0.4 | 1,266 | 23 | 3.9 | 35 |
Minnesota | 212.2 | 2,985.5 | 0.5 | 1,359 | 14 | 3.3 | 45 |
Mississippi | 89.8 | 1,163.8 | 0.1 | 960 | 51 | 4.0 | 31 |
Missouri | 245.3 | 2,927.1 | 0.6 | 1,186 | 32 | 3.1 | 48 |
Montana | 63.3 | 528.8 | 1.5 | 1,113 | 46 | 3.8 | 37 |
Nebraska | 77.1 | 1,030.9 | 0.7 | 1,122 | 44 | 2.7 | 51 |
Nevada | 108.6 | 1,548.9 | 1.6 | 1,243 | 28 | 4.5 | 17 |
New Hampshire | 66.7 | 699.6 | 0.5 | 1,443 | 10 | 4.0 | 31 |
New Jersey | 338.5 | 4,361.1 | 0.9 | 1,516 | 7 | 3.3 | 45 |
New Mexico | 68.4 | 871.9 | 1.2 | 1,150 | 36 | 4.4 | 20 |
New York | 712.7 | 9,762.4 | 1.3 | 1,687 | 5 | 4.0 | 31 |
North Carolina | 379.6 | 4,902.0 | 0.9 | 1,256 | 25 | 4.8 | 9 |
North Dakota | 36.5 | 437.4 | 1.5 | 1,221 | 30 | 3.1 | 48 |
Ohio | 341.2 | 5,558.1 | 0.4 | 1,214 | 31 | 4.7 | 12 |
Oklahoma | 129.3 | 1,684.7 | 0.8 | 1,101 | 47 | 4.7 | 12 |
Oregon | 196.1 | 2,019.2 | -0.1 | 1,338 | 16 | 4.8 | 9 |
Pennsylvania | 393.6 | 6,067.5 | 0.8 | 1,325 | 17 | 3.8 | 37 |
Rhode Island | 48.8 | 504.7 | 1.1 | 1,257 | 24 | 2.9 | 50 |
South Carolina | 188.4 | 2,290.1 | 1.8 | 1,134 | 41 | 5.1 | 7 |
South Dakota | 40.2 | 470.3 | 0.7 | 1,074 | 49 | 3.8 | 37 |
Tennessee | 234.9 | 3,287.4 | 1.3 | 1,248 | 27 | 4.2 | 25 |
Texas | 840.9 | 13,905.7 | 1.2 | 1,381 | 13 | 4.5 | 17 |
Utah | 138.2 | 1,715.2 | 0.8 | 1,249 | 26 | 5.6 | 4 |
Vermont | 32.8 | 310.8 | 0.0 | 1,227 | 29 | 4.3 | 23 |
Virginia | 319.9 | 4,140.8 | 1.4 | 1,436 | 11 | 4.8 | 9 |
Washington | 234.7 | 3,674.3 | 1.0 | 1,776 | 2 | 7.4 | 1 |
West Virginia | 61.7 | 700.1 | 0.6 | 1,127 | 42 | 4.7 | 12 |
Wisconsin | 208.5 | 2,990.8 | 0.4 | 1,168 | 34 | 3.7 | 42 |
Wyoming | 31.0 | 290.9 | 0.5 | 1,145 | 39 | 4.4 | 20 |
Puerto Rico | 54.5 | 944.0 | 1.3 | 651 | (3) | 4.7 | (3) |
Virgin Islands | 3.9 | 36.4 | -0.1 | 1,010 | (3) | 1.5 | (3) |
Footnotes: | |||||||
Note: Data are preliminary. Covered employment and wages includes workers covered by Unemployment Insurance (UI) and Unemployment Compensation for Federal Employees (UCFE) programs. | |||||||
Last Modified Date: Thursday, December 19, 2024