An official website of the United States government
 United States Department of Labor
An official website of the United States government
United States Department of Labor

The .gov means it's official.
Federal government websites often end in .gov or .mil. Before sharing sensitive information,
make sure you're on a federal government site.

The site is secure.
The
https:// ensures that you are connecting to the official website and that any
information you provide is encrypted and transmitted securely.


26-1237-CHI
Tuesday, July 14, 2026
The Consumer Price Index for All Urban Consumers (CPI-U) in the Chicago-Naperville-Elgin area declined 0.9 percent in June, the U.S. Bureau of Labor Statistics (BLS) reported today. Assistant Commissioner for Regional Operations Michael Hirniak noted that an 8.3-percent decrease in the energy index was the largest contributor to the monthly decline. The index for all items less food and energy was down 0.4 percent, while the index for food decreased 0.3 percent in June. (Data in this report are not seasonally adjusted. Accordingly, month-to-month changes may reflect seasonal influences.)
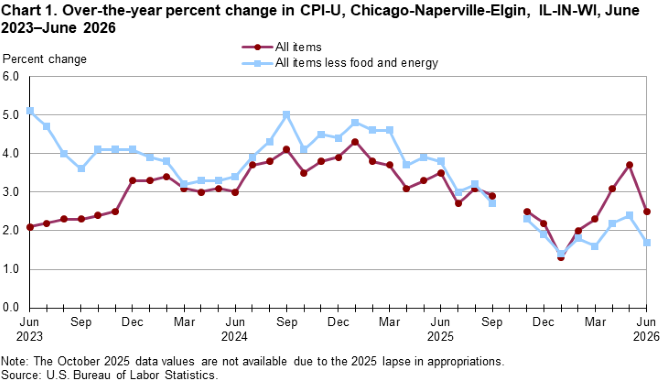
The Chicago-Naperville-Elgin area all items CPI-U increased 2.5 percent for the 12 months ending in June. The index for all items less food and energy increased 1.7 percent over the year. The energy index rose 12.5 percent, and the food index increased 2.5 percent.
The index for food declined 0.3 percent for the month of June. The food at home (grocery store purchases) index decreased 0.4 percent, with lower prices seen in 3 of the 6 major grocery store food groups. The food away from home index (restaurant, cafeteria, and vending purchases) decreased by 0.2 percent for the same period.
The index for food advanced 2.5 percent over the year. The food at home index rose 0.8 percent. Grocery food categories increasing over the year included cereals and bakery products (+6.5 percent) and meats, poultry, fish, and eggs (+3.8 percent). The index for other food at home was down 2.4 percent over the year.
EnergyThe energy index declined 8.3 percent over the month. Gasoline prices fell 13.4 percent from May to June.
From June 2025 to June 2026, the energy index rose 12.5 percent. The gasoline index was up 21.3 percent over the year.
All items less food and energyThe index for all items less food and energy declined 0.4 percent in June. Among the index’s components, prices were lower for apparel (-6.1 percent), public transportation, and other goods and services (-3.1 percent). In contrast, prices were higher for household furnishings and operations (+1.6 percent) and owners’ equivalent rent of residences (+0.2 percent).
The all items less food and energy index advanced 1.7 percent over the year. Components contributing to the increase included owners’ equivalent rent (+4.4 percent), public transportation, and rent of primary residence (+5.3 percent). In contrast, prices were lower for education and communication (-3.2 percent) and medical care services.
The July 2026 Consumer Price Index for the Chicago-Naperville-Elgin area is scheduled to be released on Wednesday, August 12, 2026.
The Consumer Price Index (CPI) is a measure of the average change in prices over time in a fixed market basket of goods and services. The Consumer Price Index for Chicago is published monthly. The set of components and sub-aggregates published for regional and metropolitan indexes is more limited than at the U.S. city average level; these indexes are byproducts of the national CPI program. Each local index has a much smaller sample size than the national or regional indexes and is, therefore, subject to substantially more sampling and other measurement error. As a result, local-area indexes are more volatile than the national or regional indexes. In addition, local indexes are not adjusted for seasonal influences. NOTE: Area indexes do not measure differences in the level of prices between cities; they only measure the average change in prices for each area since the base period.
The Chicago-Naperville-Elgin, IL-IN-WI Core Based Statistical Area includes Cook, DeKalb, DuPage, Grundy, Kane, Kendall, Lake, McHenry, and Will Counties in Illinois; Jasper, Lake, Newton, and Porter Counties in Indiana; and Kenosha County in Wisconsin.
Refer to the national CPI news release technical note or the Handbook of Methods for more information.
If you are deaf, hard of hearing, or have a speech disability, please dial 7-1-1 to access telecommunications relay services.
| Expenditure category | Indexes | Percent change from: | |||||
|---|---|---|---|---|---|---|---|
| Historical data | Apr. 2026 | May 2026 | Jun. 2026 | Jun. 2025 | Apr. 2026 | May 2026 | |
All items |  | 309.364 | 312.867 | 309.915 | 2.5 | 0.2 | -0.9 |
All items (1967=100) | | 924.251 | 934.718 | 925.898 | - | - | - |
Food and beverages | | 339.855 | 338.235 | 337.128 | 2.3 | -0.8 | -0.3 |
Food | | 340.839 | 339.404 | 338.225 | 2.5 | -0.8 | -0.3 |
Food at home | | 309.611 | 307.450 | 306.103 | 0.8 | -1.1 | -0.4 |
Cereals and bakery products | | 353.368 | 352.654 | 359.153 | 6.5 | 1.6 | 1.8 |
Meats, poultry, fish, and eggs | | 345.738 | 346.590 | 340.333 | 3.8 | -1.6 | -1.8 |
Dairy and related products | | 258.651 | 256.128 | 263.238 | -2.1 | 1.8 | 2.8 |
Fruits and vegetables | | 368.502 | 361.514 | 345.579 | 0.5 | -6.2 | -4.4 |
Nonalcoholic beverages and beverage materials(1) | | 279.176 | 285.447 | 272.680 | -1.5 | -2.3 | -4.5 |
Other food at home | | 247.598 | 241.723 | 249.199 | -2.4 | 0.6 | 3.1 |
Food away from home | | 378.866 | 378.804 | 377.988 | 5.3 | -0.2 | -0.2 |
Alcoholic beverages | | 323.112 | 319.115 | 318.961 | 0.0 | -1.3 | 0.0 |
Housing | | 336.871 | 339.819 | 340.427 | 3.6 | 1.1 | 0.2 |
Shelter | | 432.065 | 434.635 | 435.119 | 4.5 | 0.7 | 0.1 |
Rent of primary residence | | 464.262 | 466.072 | 467.954 | 5.3 | 0.8 | 0.4 |
Owners' equiv. rent of residences(2) | | 446.463 | 448.023 | 449.053 | 4.4 | 0.6 | 0.2 |
Owners' equiv. rent of primary residence(2) | | 446.463 | 448.023 | 449.053 | 4.4 | 0.6 | 0.2 |
Household furnishings and operations | | 106.480 | 104.808 | 106.489 | -0.8 | 0.0 | 1.6 |
Apparel | | 97.156 | 101.937 | 95.759 | 4.2 | -1.4 | -6.1 |
Transportation | | 256.411 | 264.466 | 254.061 | 3.1 | -0.9 | -3.9 |
Private transportation | | 255.775 | 262.741 | 252.256 | 0.9 | -1.4 | -4.0 |
New and used motor vehicles(3) | | 117.346 | 117.709 | 118.205 | 0.3 | 0.7 | 0.4 |
New vehicles(1) | | 215.727 | 215.953 | 216.255 | 0.7 | 0.2 | 0.1 |
Used cars and trucks(1) | | 349.147 | 354.711 | 359.576 | -1.2 | 3.0 | 1.4 |
Motor fuel | | 385.562 | 432.091 | 374.405 | 21.5 | -2.9 | -13.4 |
Gasoline (all types) | | 382.805 | 428.939 | 371.592 | 21.3 | -2.9 | -13.4 |
Gasoline, unleaded regular(4) | | 369.725 | 415.118 | 358.024 | 21.6 | -3.2 | -13.8 |
| 425.249 | 473.022 | 419.575 | 20.3 | -1.3 | -11.3 | |
Gasoline, unleaded premium(4) | | 412.403 | 453.994 | 408.654 | 18.9 | -0.9 | -10.0 |
Medical care | | 565.150 | 566.596 | 567.919 | -0.9 | 0.5 | 0.2 |
Recreation(3) | | 143.900 | 143.261 | 143.266 | 2.5 | -0.4 | 0.0 |
Education and communication(3) | | 138.426 | 140.376 | 139.681 | -3.2 | 0.9 | -0.5 |
Tuition, other school fees, and childcare(6) | | 95.383 | 95.383 | 95.786 | -3.8 | 0.4 | 0.4 |
Other goods and services | | 528.548 | 543.923 | 527.303 | -0.9 | -0.2 | -3.1 |
Footnotes | |||||||
- Data not available. | |||||||
| Special aggregate index | Indexes | Percent change from: | |||||
|---|---|---|---|---|---|---|---|
| Historical data | Apr. 2026 | May 2026 | Jun. 2026 | Jun. 2025 | Apr. 2026 | May 2026 | |
All items | | 309.364 | 312.867 | 309.915 | 2.5 | 0.2 | -0.9 |
Food | | 340.839 | 339.404 | 338.225 | 2.5 | -0.8 | -0.3 |
Energy | | 296.249 | 326.789 | 299.679 | 12.5 | 1.2 | -8.3 |
All items less food and energy | | 310.086 | 312.199 | 310.953 | 1.7 | 0.3 | -0.4 |
All items less energy | | 314.059 | 315.642 | 314.408 | 1.9 | 0.1 | -0.4 |
All items less medical care | | 298.740 | 302.330 | 299.200 | 2.7 | 0.2 | -1.0 |
All items less shelter | | 267.755 | 271.515 | 267.517 | 1.5 | -0.1 | -1.5 |
Commodities | | 210.354 | 213.518 | 209.212 | 3.1 | -0.5 | -2.0 |
Commodities less food | | 155.718 | 160.094 | 155.110 | 3.6 | -0.4 | -3.1 |
Commodities less food & beverages | | 149.921 | 154.451 | 149.406 | 3.8 | -0.3 | -3.3 |
Durables | | 93.285 | 93.053 | 93.631 | -1.3 | 0.4 | 0.6 |
Nondurables | | 277.102 | 282.859 | 274.769 | 4.7 | -0.8 | -2.9 |
Nondurables less food | | 222.201 | 233.246 | 220.139 | 7.4 | -0.9 | -5.6 |
Nondurables less food & beverages | | 215.271 | 227.206 | 213.344 | 8.2 | -0.9 | -6.1 |
Services | | 402.702 | 406.374 | 405.144 | 2.0 | 0.6 | -0.3 |
Services less rent of shelter(1) | | 392.037 | 397.004 | 393.946 | -0.4 | 0.5 | -0.8 |
Services less medical care services | | 389.008 | 392.976 | 391.639 | 2.4 | 0.7 | -0.3 |
- Data not available. | |||||||
Last Modified Date: Tuesday, July 14, 2026