An official website of the United States government
An official website of the United States government
The .gov means it's official.
Federal government websites often end in .gov or .mil. Before sharing sensitive information,
make sure you're on a federal government site.
The site is secure.
The
https:// ensures that you are connecting to the official website and that any
information you provide is encrypted and transmitted securely.
26-482-CHI
Wednesday, March 18, 2026
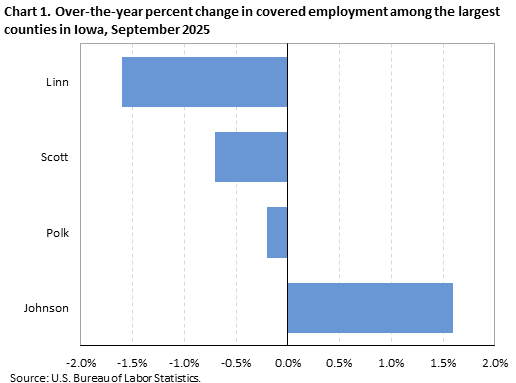
Employment declined in 3 of the 4 largest counties in Iowa from September 2024 to September 2025, the U.S. Bureau of Labor Statistics reported today. Assistant Commissioner for Regional Operations Michael Hirniak noted that Linn County had the largest over-the-year decrease in employment, with a loss of 1.6 percent. (See chart 1 and table 1.)
Among the four largest counties in Iowa, employment was highest in Polk (311,800) in September 2025. Together, the four largest counties accounted for 39.7 percent of total covered employment within the state. Nationwide, the 372 largest counties comprise 73.2 percent of total covered employment in the United States. (Large counties and county equivalents are those with annual average employment levels of 75,000 or more in 2024.)
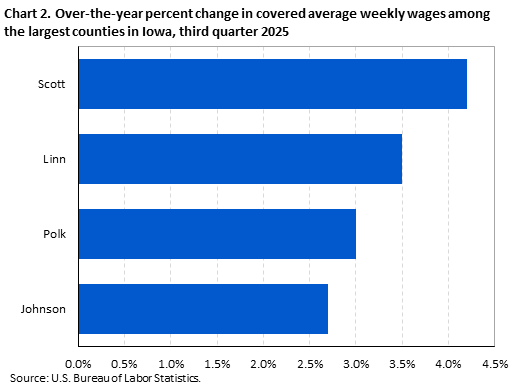
Large county average weekly wages in the third quarter 2025All four large Iowa counties reported average weekly wage gains over the year. (See chart 2.) Scott had the largest gain (+4.2 percent). Wages increased 3.5 percent in Linn, 3.0 percent in Polk, and 2.7 percent in Johnson.
Weekly wages in all large counties in Iowa were below the national average of $1,459. Average weekly wages ranged from $1,400 in Polk to $1,177 in Scott.
Smaller county average weekly wages in the third quarter of 2025Employment and wage levels (but not over-the-year changes) are also available for the 95 small counties in Iowa, defined as having employment below 75,000 in 2024. (See table 2.) Wage levels in 94 of the 95 smaller counties were below the national average. Monroe reported the highest average weekly wage ($1,474). Decatur reported the lowest average weekly wage ($855) in the state.
Among all 99 Iowa counties, 24 reported average weekly wages of less than $975, 21 registered wages from $975 to $1,024, 25 had wages from $1,025 to $1,074, 11 reported wages from $1,075 to $1,124, and 18 had average weekly wages of $1,125 or higher. (See map 1 and table 2.)
QCEW data for states have been included in this release in table 3.
Nationwide coverage of the largest counties is published in the County Employment and Wages news release. Additional information about quarterly employment and wages data is available in the news release Technical Note and from the Quarterly Census of Employment and Wages website.
If you are deaf, hard of hearing, or have a speech disability, please dial 7-1-1 to access telecommunications relay services.
The County Employment and Wages release for the fourth quarter 2025 is scheduled to be released on Tuesday, June 2, 2026.
| Area | Establishments, third quarter (thousands) |
Employment | Average weekly wage (1) | |||||
|---|---|---|---|---|---|---|---|---|
| September 2025 (thousands) |
Percent change, September 2024–25 (2) |
National ranking by percent change (3) |
Third quarter 2025 ($) |
National ranking by level (3) |
Percent change, third quarter 2024–25 (2) |
National ranking by percent change (3) |
||
|
United States (4) |
12,353.8 | 155,767.7 | 0.1 | -- | 1,459 | -- | 4.7 | -- |
|
Iowa |
109.6 | 1,549.3 | -0.9 | -- | 1,194 | 39 | 3.6 | 38 |
|
Johnson |
5.0 | 86.2 | 1.6 | 19 | 1,293 | 186 | 2.7 | 309 |
|
Linn |
7.7 | 124.1 | -1.6 | 340 | 1,310 | 177 | 3.5 | 238 |
|
Polk |
20.2 | 311.8 | -0.2 | 199 | 1,400 | 114 | 3.0 | 288 |
|
Scott |
6.2 | 92.7 | -0.7 | 276 | 1,177 | 280 | 4.2 | 157 |
|
Footnotes: |
||||||||
|
Note: Data are preliminary. Dashes indicate data not applicable or available. Covered employment and wages include workers covered by Unemployment Insurance (UI) and Unemployment Compensation for Federal Employees (UCFE) programs. |
||||||||
| Area | Establishments | Employment September 2025 | Average weekly wage ($) (1) |
|---|---|---|---|
|
United States (2) |
12,353,804 | 155,767,691 | 1,459 |
|
Iowa |
109,550 | 1,549,313 | 1,194 |
|
Adair |
326 | 3,578 | 1,291 |
|
Adams |
142 | 1,130 | 962 |
|
Allamakee |
467 | 4,747 | 935 |
|
Appanoose |
383 | 4,464 | 946 |
|
Audubon |
228 | 1,714 | 1,043 |
|
Benton |
695 | 5,969 | 1,000 |
|
Black Hawk |
3,917 | 70,161 | 1,124 |
|
Boone |
731 | 8,883 | 1,016 |
|
Bremer |
747 | 9,403 | 1,036 |
|
Buchanan |
631 | 6,723 | 987 |
|
Buena Vista |
592 | 10,245 | 1,063 |
|
Butler |
425 | 3,704 | 1,010 |
|
Calhoun |
316 | 2,784 | 941 |
|
Carroll |
915 | 10,866 | 994 |
|
Cass |
518 | 5,678 | 1,006 |
|
Cedar |
583 | 5,120 | 958 |
|
Cerro Gordo |
1,666 | 23,136 | 1,106 |
|
Cherokee |
440 | 4,841 | 956 |
|
Chickasaw |
408 | 5,324 | 1,139 |
|
Clarke |
240 | 4,683 | 1,009 |
|
Clay |
707 | 8,481 | 1,063 |
|
Clayton |
610 | 6,196 | 1,038 |
|
Clinton |
1,467 | 18,700 | 1,046 |
|
Crawford |
491 | 6,326 | 1,025 |
|
Dallas |
3,619 | 55,983 | 1,429 |
|
Davis |
241 | 1,975 | 1,004 |
|
Decatur |
224 | 2,146 | 855 |
|
Delaware |
590 | 6,825 | 1,045 |
|
Des Moines |
1,394 | 20,038 | 1,020 |
|
Dickinson |
933 | 9,824 | 888 |
|
Dubuque |
3,644 | 57,319 | 1,141 |
|
Emmet |
328 | 3,298 | 916 |
|
Fayette |
668 | 6,922 | 984 |
|
Floyd |
468 | 5,522 | 1,059 |
|
Franklin |
359 | 3,856 | 1,048 |
|
Fremont |
277 | 2,131 | 965 |
|
Greene |
298 | 3,146 | 1,058 |
|
Grundy |
380 | 4,144 | 1,202 |
|
Guthrie |
376 | 3,185 | 1,065 |
|
Hamilton |
481 | 5,760 | 1,118 |
|
Hancock |
365 | 5,649 | 1,127 |
|
Hardin |
618 | 6,611 | 1,079 |
|
Harrison |
480 | 4,028 | 1,023 |
|
Henry |
628 | 8,191 | 1,021 |
|
Howard |
345 | 4,311 | 1,005 |
|
Humboldt |
350 | 3,722 | 1,004 |
|
Ida |
295 | 3,658 | 1,132 |
|
Iowa |
716 | 8,198 | 979 |
|
Jackson |
655 | 5,683 | 878 |
|
Jasper |
959 | 10,821 | 1,006 |
|
Jefferson |
742 | 6,978 | 1,106 |
|
Johnson |
5,036 | 86,182 | 1,293 |
|
Jones |
646 | 6,256 | 961 |
|
Keokuk |
306 | 2,228 | 920 |
|
Kossuth |
627 | 6,412 | 1,015 |
|
Lee |
1,024 | 13,434 | 1,112 |
|
Linn |
7,716 | 124,051 | 1,310 |
|
Louisa |
281 | 3,763 | 961 |
|
Lucas |
237 | 3,026 | 1,059 |
|
Lyon |
544 | 4,924 | 929 |
|
Madison |
551 | 4,159 | 983 |
|
Mahaska |
609 | 7,995 | 1,140 |
|
Marion |
1,056 | 19,449 | 1,154 |
|
Marshall |
980 | 15,904 | 1,097 |
|
Mills |
471 | 3,147 | 1,033 |
|
Mitchell |
368 | 3,831 | 1,046 |
|
Monona |
294 | 2,499 | 904 |
|
Monroe |
245 | 3,551 | 1,474 |
|
Montgomery |
358 | 3,880 | 1,035 |
|
Muscatine |
1,191 | 20,785 | 1,168 |
|
O'Brien |
603 | 6,513 | 958 |
|
Osceola |
266 | 2,595 | 1,030 |
|
Page |
459 | 6,210 | 1,026 |
|
Palo Alto |
326 | 3,659 | 933 |
|
Plymouth |
860 | 11,428 | 1,157 |
|
Pocahontas |
247 | 2,508 | 1,030 |
|
Polk |
20,158 | 311,774 | 1,400 |
|
Pottawattamie |
2,672 | 41,627 | 1,110 |
|
Poweshiek |
686 | 9,644 | 1,114 |
|
Ringgold |
179 | 1,405 | 905 |
|
Sac |
379 | 2,966 | 955 |
|
Scott |
6,170 | 92,653 | 1,177 |
|
Shelby |
428 | 5,493 | 1,002 |
|
Sioux |
1,544 | 22,889 | 1,092 |
|
Story |
2,977 | 47,142 | 1,240 |
|
Tama |
428 | 5,349 | 946 |
|
Taylor |
187 | 2,034 | 1,035 |
|
Union |
444 | 5,777 | 1,031 |
|
Van Buren |
216 | 1,910 | 967 |
|
Wapello |
862 | 15,110 | 1,040 |
|
Warren |
1,404 | 13,798 | 1,007 |
|
Washington |
846 | 8,694 | 987 |
|
Wayne |
175 | 1,992 | 1,065 |
|
Webster |
1,147 | 17,407 | 1,117 |
|
Winnebago |
375 | 3,643 | 955 |
|
Winneshiek |
757 | 10,611 | 1,056 |
|
Woodbury |
3,228 | 50,819 | 1,070 |
|
Worth |
225 | 2,260 | 937 |
|
Wright |
455 | 6,231 | 1,141 |
|
Footnotes: |
|||
|
Note: Data are preliminary. Dashes indicate data not applicable or available. Covered employment and wages include workers covered by Unemployment Insurance (UI) and Unemployment Compensation for Federal Employees (UCFE) programs. |
|||
| State | Establishments, third quarter (thousands) |
Employment | Average weekly wage (1) | ||||
|---|---|---|---|---|---|---|---|
| September 2025 (thousands) |
Percent change, September 2024–25 |
Third quarter 2025 ($) |
National ranking by level |
Percent change, third quarter 2024–25 |
National ranking by percent change |
||
|
United States (2) |
12,353.8 | 155,767.7 | 0.1 | 1,459 | -- | 4.7 | -- |
|
Alabama |
165.7 | 2,119.0 | 0.6 | 1,212 | 36 | 3.6 | 38 |
|
Alaska |
25.3 | 342.4 | -0.1 | 1,455 | 13 | 5.3 | 7 |
|
Arizona |
228.4 | 3,215.4 | -0.2 | 1,360 | 19 | 4.0 | 31 |
|
Arkansas |
111.2 | 1,310.5 | 0.5 | 1,135 | 49 | 3.8 | 33 |
|
California |
1,986.7 | 18,281.7 | 0.3 | 1,815 | 4 | 7.2 | 2 |
|
Colorado |
252.9 | 2,886.4 | -0.6 | 1,570 | 7 | 5.7 | 3 |
|
Connecticut |
149.6 | 1,693.8 | 0.1 | 1,604 | 6 | 3.8 | 33 |
|
Delaware |
46.7 | 480.8 | 0.0 | 1,394 | 17 | 4.8 | 13 |
|
District of Columbia |
51.5 | 737.4 | -3.1 | 2,393 | 1 | 5.7 | 3 |
|
Florida |
892.1 | 9,818.1 | -0.2 | 1,342 | 21 | 5.1 | 8 |
|
Georgia |
397.2 | 4,874.5 | 0.4 | 1,349 | 20 | 3.5 | 43 |
|
Hawaii |
62.1 | 640.1 | 0.1 | 1,342 | 21 | 3.1 | 48 |
|
Idaho |
103.7 | 879.8 | 1.3 | 1,180 | 44 | 4.9 | 11 |
|
Illinois |
386.5 | 6,086.3 | -0.1 | 1,457 | 12 | 4.3 | 23 |
|
Indiana |
197.1 | 3,198.4 | 0.1 | 1,214 | 35 | 4.3 | 23 |
|
Iowa |
109.6 | 1,549.3 | -0.9 | 1,194 | 39 | 3.6 | 38 |
|
Kansas |
102.2 | 1,431.7 | 0.1 | 1,179 | 45 | 3.8 | 33 |
|
Kentucky |
160.7 | 1,995.4 | -0.4 | 1,176 | 46 | 4.3 | 23 |
|
Louisiana |
158.7 | 1,913.1 | -0.1 | 1,187 | 42 | 3.3 | 46 |
|
Maine |
67.4 | 659.2 | -0.2 | 1,231 | 33 | 5.0 | 10 |
|
Maryland |
199.5 | 2,739.5 | -1.3 | 1,526 | 9 | 3.8 | 33 |
|
Massachusetts |
293.2 | 3,625.0 | -0.9 | 1,818 | 3 | 4.8 | 13 |
|
Michigan |
316.0 | 4,423.8 | -0.4 | 1,323 | 25 | 4.5 | 18 |
|
Minnesota |
214.3 | 2,958.6 | 0.2 | 1,438 | 15 | 3.6 | 38 |
|
Mississippi |
91.3 | 1,172.6 | 0.0 | 1,005 | 51 | 4.7 | 15 |
|
Missouri |
256.0 | 2,903.7 | -0.4 | 1,249 | 31 | 4.4 | 21 |
|
Montana |
64.6 | 518.3 | -0.4 | 1,182 | 43 | 5.1 | 8 |
|
Nebraska |
78.6 | 1,021.8 | -0.1 | 1,190 | 40 | 3.1 | 48 |
|
Nevada |
109.5 | 1,581.0 | 1.4 | 1,314 | 27 | 4.3 | 23 |
|
New Hampshire |
67.3 | 687.8 | -0.6 | 1,481 | 11 | 5.5 | 6 |
|
New Jersey |
334.9 | 4,301.0 | 0.4 | 1,558 | 8 | 3.6 | 38 |
|
New Mexico |
69.0 | 876.4 | 0.3 | 1,190 | 40 | 3.2 | 47 |
|
New York |
720.8 | 9,808.4 | 0.4 | 1,757 | 5 | 4.7 | 15 |
|
North Carolina |
386.3 | 4,939.4 | 0.5 | 1,328 | 23 | 4.2 | 27 |
|
North Dakota |
36.7 | 433.8 | -0.5 | 1,291 | 29 | 2.8 | 50 |
|
Ohio |
346.6 | 5,537.8 | 0.1 | 1,279 | 30 | 3.4 | 44 |
|
Oklahoma |
128.8 | 1,697.9 | -0.3 | 1,143 | 48 | 4.5 | 18 |
|
Oregon |
180.5 | 1,994.7 | -1.3 | 1,409 | 16 | 4.2 | 27 |
|
Pennsylvania |
397.2 | 6,066.3 | 0.2 | 1,383 | 18 | 4.1 | 30 |
|
Rhode Island |
48.8 | 503.3 | 0.2 | 1,322 | 26 | 4.7 | 15 |
|
South Carolina |
190.8 | 2,312.3 | 0.7 | 1,198 | 38 | 4.9 | 11 |
|
South Dakota |
40.9 | 462.9 | 0.1 | 1,146 | 47 | 4.0 | 31 |
|
Tennessee |
224.2 | 3,255.5 | -1.2 | 1,327 | 24 | 5.7 | 3 |
|
Texas |
854.9 | 14,062.3 | 0.7 | 1,444 | 14 | 3.6 | 38 |
|
Utah |
142.4 | 1,745.9 | 1.2 | 1,297 | 28 | 3.8 | 33 |
|
Vermont |
34.1 | 307.2 | -0.7 | 1,243 | 32 | 4.4 | 21 |
|
Virginia |
324.0 | 4,142.4 | 0.7 | 1,504 | 10 | 4.2 | 27 |
|
Washington |
242.3 | 3,639.4 | -0.1 | 1,923 | 2 | 7.7 | 1 |
|
West Virginia |
62.1 | 701.1 | -0.1 | 1,121 | 50 | 3.4 | 44 |
|
Wisconsin |
211.6 | 2,949.1 | -0.4 | 1,228 | 34 | 4.5 | 18 |
|
Wyoming |
31.7 | 285.6 | -1.1 | 1,201 | 37 | 2.0 | 51 |
|
Puerto Rico |
52.8 | 945.5 | -0.6 | 687 | (3) | 2.7 | (3) |
|
Virgin Islands |
3.0 | 33.2 | -5.4 | 1,025 | (3) | 4.7 | (3) |
|
Footnotes: |
|||||||
|
Note: Data are preliminary. Dashes indicate data not applicable or available. Covered employment and wages include workers covered by Unemployment Insurance (UI) and Unemployment Compensation for Federal Employees (UCFE) programs. |
|||||||
Last Modified Date: Wednesday, March 18, 2026