An official website of the United States government
An official website of the United States government
The .gov means it's official.
Federal government websites often end in .gov or .mil. Before sharing sensitive information,
make sure you're on a federal government site.
The site is secure.
The
https:// ensures that you are connecting to the official website and that any
information you provide is encrypted and transmitted securely.
14-54-NEW
Tuesday, January 14, 2014
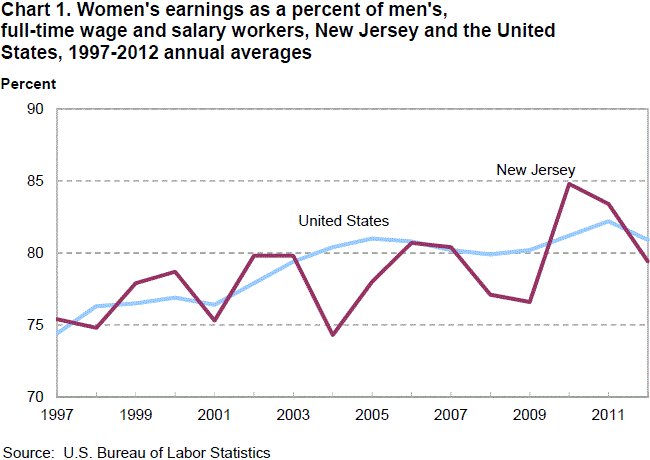
In 2012, New Jersey women who were full-time wage and salary workers had median weekly earnings of $818 or 79.4 percent of the $1,030 median weekly earnings for their male counterparts, the U.S. Bureau of Labor Statistics reported today. Chief Regional Economist Martin Kohli noted that the 2012 women’s to men’s earnings ratio in New Jersey declined 4 percentage points from the previous year. Nationwide, women earned $691 or 80.9 percent of the $854 median for men. (See table 1. Earnings in this report do not control for many factors that can be significant in explaining earnings differences.)
In New Jersey, the ratio of women’s to men’s earnings has generally trended upward since 2004 when the series recorded a low of 74.3 percent. (See chart 1.)
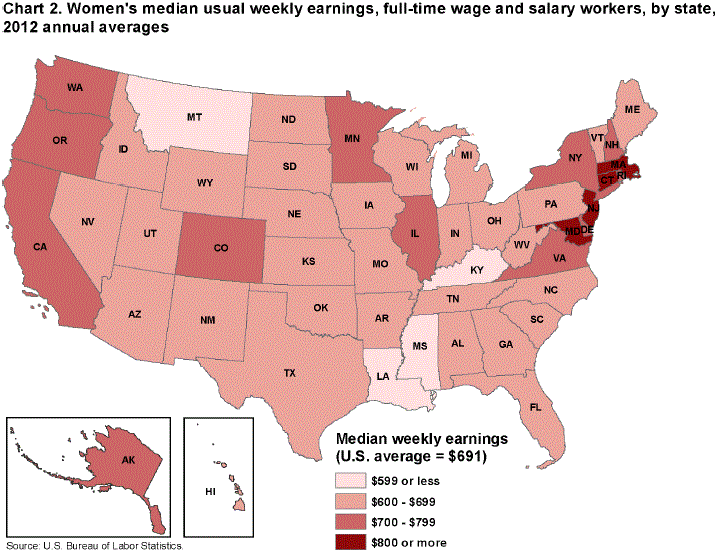
Among the 50 states, median weekly earnings of women in full-time wage and salary positions in 2012 ranged from $566 in Montana to $868 in Connecticut. States with the highest wages for women were located along the Eastern Seaboard. In addition to Connecticut and New Jersey, women’s earnings in Maryland and Massachusetts were also above $800 per week. (See table 1 and chart 2.)
Across the nation, median weekly earnings for men were lowest in Arkansas at $717 and highest in Connecticut at $1,127. Four of the five highest-paying states for full-time male workers (Connecticut, Massachusetts, New Jersey, and Maryland) were also located along the Eastern Seaboard. The sole exception was on the West Coast – Alaska. (See table 1.)
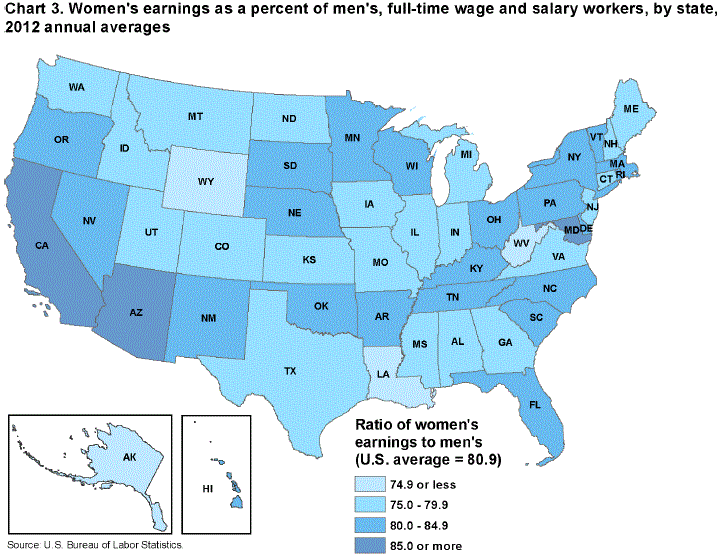
The ratio of female-to-male earnings in 2012 varied across the nation, ranging from 65.5 percent in Wyoming to 86.8 percent in Arizona. (See table 1.) Of the three states with women’s to men’s ratios of 85 percent or higher, two were located in the West (Arizona and California) and one was located in the East (Maryland). (See chart 3.) The differences among the states reflect, in part, variation in the occupations and industries found in each state and in the age composition of each state’s labor force. In addition, comparisons by gender are on a broad level and do not control for factors such as educational attainment which can be significant in explaining earnings differences.
For more information on the median weekly earnings of women and men, see Bureau of Labor Statistics Report 1045, Highlights of Women’s Earnings in 2012, issued in October 2013; copies are available on the Internet at www.bls.gov/cps/cpswom2012.pdf. Information in this release is also available to sensory impaired individuals. Voice phone: (202) 691-5200; Federal Relay Service: (800)-877-8339.
The estimates in this report were obtained from the Current Population Survey (CPS), which provides a wide range of information on the labor force, employment, and unemployment. This survey is conducted monthly for the Bureau of Labor Statistics by the U.S. Census Bureau, using a national sample of about 60,000 households, with coverage in all 50 states and the District of Columbia. The earnings data are collected from one-fourth of the CPS monthly sample.
Statistics based on the CPS data are subject to both sampling and nonsampling error. The differences among data for the states reflect, in part, variations in the occupation, industry, and age composition of each state’s labor force. In addition, sampling error for the state estimates is considerably larger than it is for the national data.
The principal definitions used in connection with the earnings series in this release are described below.
Usual weekly earnings. Data represent earnings before taxes and other deductions and include any overtime pay, commissions, or tips usually received (at the main job in the case of multiple jobholders.)
Median weekly earnings. The median is the amount which divides a given earnings distribution into two equal groups, one having earnings above the median and the other having earnings below the median.
Wage and salary workers. Workers who receive wages, salaries, commissions, tips, payment in kind, or piece rates. The group includes employees in both the private and public sectors but, for the purposes of the earnings series, excludes all self-employed persons, regardless of whether or not their businesses are incorporated.
Full-time worker. Workers who usually work 35 hours or more per week at their sole or principal job.
| State | Both sexes | Women | Men | Women’s earnings as percent of men’s | ||||||
|---|---|---|---|---|---|---|---|---|---|---|
| Number of workers (thousands) | Median weekly earnings | Standard error of median | Number of workers (thousands) | Median weekly earnings | Standard error of median | Number of workers (thousands) | Median weekly earnings | Standard error of median | ||
|
United States |
102,749 | $768 | $2 | 45,462 | $691 | $3 | 57,286 | $854 | $4 | 80.9 |
|
Alabama |
1,522 | 724 | 14 | 683 | 620 | 15 | 839 | 812 | 27 | 76.4 |
|
Alaska |
248 | 888 | 16 | 110 | 757 | 14 | 138 | 1,025 | 27 | 73.9 |
|
Arizona |
1,969 | 732 | 9 | 878 | 670 | 14 | 1,090 | 772 | 18 | 86.8 |
|
Arkansas |
971 | 651 | 15 | 438 | 603 | 10 | 534 | 717 | 21 | 84.1 |
|
California |
11,570 | 820 | 10 | 4,890 | 754 | 9 | 6,680 | 877 | 12 | 86.0 |
|
Colorado |
1,714 | 850 | 18 | 725 | 750 | 15 | 989 | 958 | 24 | 78.3 |
|
Connecticut |
1,178 | 988 | 22 | 519 | 868 | 29 | 659 | 1,127 | 40 | 77.0 |
|
Delaware |
309 | 807 | 20 | 146 | 737 | 20 | 163 | 888 | 36 | 83.0 |
|
District of Columbia |
276 | 1,102 | 37 | 138 | 1,072 | 43 | 138 | 1,131 | 38 | 94.8 |
|
Florida |
6,299 | 735 | 6 | 2,992 | 676 | 9 | 3,307 | 796 | 13 | 84.9 |
|
Georgia |
3,287 | 737 | 13 | 1,503 | 640 | 17 | 1,784 | 838 | 26 | 76.4 |
|
Hawaii |
430 | 753 | 14 | 192 | 689 | 16 | 238 | 839 | 35 | 82.1 |
|
Idaho |
478 | 706 | 13 | 187 | 614 | 11 | 291 | 785 | 15 | 78.2 |
|
Illinois |
4,368 | 809 | 11 | 1,958 | 708 | 13 | 2,411 | 895 | 16 | 79.1 |
|
Indiana |
2,158 | 716 | 14 | 936 | 632 | 16 | 1,221 | 809 | 19 | 78.1 |
|
Iowa |
1,096 | 744 | 14 | 491 | 654 | 17 | 605 | 823 | 20 | 79.5 |
|
Kansas |
988 | 738 | 14 | 428 | 649 | 14 | 560 | 825 | 22 | 78.7 |
|
Kentucky |
1,414 | 663 | 12 | 644 | 596 | 13 | 770 | 733 | 18 | 81.3 |
|
Louisiana |
1,449 | 676 | 18 | 637 | 573 | 17 | 812 | 796 | 20 | 72.0 |
|
Maine |
423 | 741 | 13 | 191 | 654 | 25 | 232 | 823 | 25 | 79.5 |
|
Maryland |
2,198 | 921 | 20 | 1,056 | 842 | 23 | 1,141 | 988 | 27 | 85.2 |
|
Massachusetts |
2,167 | 935 | 12 | 980 | 840 | 19 | 1,187 | 1,040 | 28 | 80.8 |
|
Michigan |
2,876 | 783 | 14 | 1,237 | 687 | 18 | 1,639 | 889 | 20 | 77.3 |
|
Minnesota |
1,897 | 865 | 15 | 816 | 779 | 23 | 1,081 | 948 | 24 | 82.2 |
|
Mississippi |
922 | 677 | 14 | 413 | 582 | 19 | 509 | 776 | 23 | 75.0 |
|
Missouri |
2,013 | 750 | 18 | 913 | 660 | 19 | 1,099 | 841 | 30 | 78.5 |
|
Montana |
293 | 658 | 21 | 137 | 566 | 18 | 156 | 733 | 23 | 77.2 |
|
Nebraska |
680 | 728 | 14 | 312 | 663 | 17 | 369 | 787 | 21 | 84.2 |
|
Nevada |
897 | 690 | 11 | 399 | 620 | 10 | 497 | 768 | 19 | 80.7 |
|
New Hampshire |
478 | 883 | 21 | 214 | 772 | 24 | 264 | 975 | 29 | 79.2 |
|
New Jersey |
3,142 | 935 | 13 | 1,425 | 818 | 26 | 1,717 | 1,030 | 25 | 79.4 |
|
New Mexico |
614 | 737 | 17 | 274 | 645 | 25 | 340 | 802 | 22 | 80.4 |
|
New York |
6,513 | 819 | 10 | 2,951 | 746 | 9 | 3,562 | 900 | 14 | 82.9 |
|
North Carolina |
3,124 | 727 | 10 | 1,392 | 641 | 13 | 1,732 | 792 | 13 | 80.9 |
|
North Dakota |
266 | 735 | 12 | 116 | 651 | 12 | 149 | 834 | 23 | 78.1 |
|
Ohio |
3,662 | 739 | 9 | 1,589 | 664 | 10 | 2,073 | 802 | 15 | 82.8 |
|
Oklahoma |
1,299 | 695 | 11 | 570 | 631 | 15 | 729 | 760 | 16 | 83.0 |
|
Oregon |
1,144 | 823 | 19 | 480 | 756 | 17 | 664 | 901 | 28 | 83.9 |
|
Pennsylvania |
4,320 | 774 | 8 | 1,898 | 694 | 11 | 2,423 | 849 | 13 | 81.7 |
|
Rhode Island |
342 | 796 | 21 | 158 | 733 | 23 | 184 | 886 | 42 | 82.7 |
|
South Carolina |
1,462 | 669 | 15 | 677 | 603 | 17 | 785 | 724 | 18 | 83.3 |
|
South Dakota |
282 | 664 | 10 | 129 | 604 | 9 | 153 | 737 | 16 | 82.0 |
|
Tennessee |
2,125 | 675 | 12 | 922 | 611 | 12 | 1,203 | 740 | 15 | 82.6 |
|
Texas |
8,904 | 718 | 7 | 3,852 | 633 | 9 | 5,051 | 795 | 15 | 79.6 |
|
Utah |
879 | 760 | 14 | 326 | 661 | 18 | 552 | 870 | 25 | 76.0 |
|
Vermont |
216 | 767 | 16 | 96 | 692 | 19 | 120 | 859 | 29 | 80.6 |
|
Virginia |
2,974 | 846 | 17 | 1,335 | 756 | 21 | 1,640 | 951 | 24 | 79.5 |
|
Washington |
2,204 | 870 | 21 | 935 | 746 | 20 | 1,269 | 982 | 28 | 76.0 |
|
West Virginia |
574 | 740 | 14 | 257 | 614 | 14 | 317 | 846 | 28 | 72.6 |
|
Wisconsin |
1,929 | 783 | 16 | 833 | 696 | 25 | 1,095 | 863 | 20 | 80.6 |
|
Wyoming |
207 | 808 | 17 | 81 | 645 | 22 | 126 | 984 | 19 | 65.5 |
|
Note: In general, the sampling error for the state estimates is considerably larger than it is for the national estimates; thus, comparisons of |
||||||||||
Last Modified Date: Tuesday, January 14, 2014