An official website of the United States government
An official website of the United States government
The .gov means it's official.
Federal government websites often end in .gov or .mil. Before sharing sensitive information,
make sure you're on a federal government site.
The site is secure.
The
https:// ensures that you are connecting to the official website and that any
information you provide is encrypted and transmitted securely.
15-2360-NEW
Tuesday, December 08, 2015
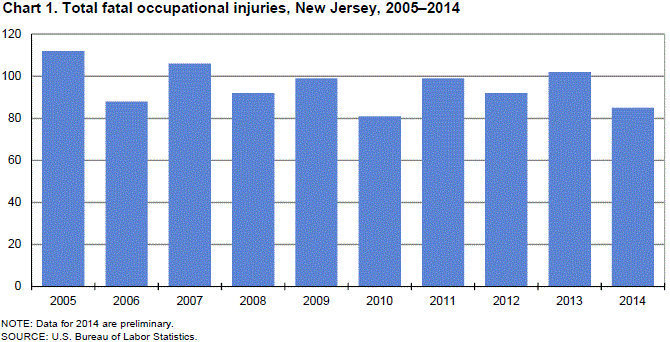
Fatal work injuries totaled 85 in 2014 for New Jersey, the U.S. Bureau of Labor Statistics reported today. Chief Regional Economist Martin Kohli noted that while the 2014 count was preliminary, the number of work-related fatalities in New Jersey declined by 17 over the year. Fatal occupational injuries in the state have ranged from a high of 145 in 1993 to a low of 81 in 2010. (See chart 1.)
A preliminary total of 4,679 fatal work injuries were recorded in the United States in 2014, up from the revised count of 4,585 fatal work injuries in 2013, according to results from the Census of Fatal Occupational Injuries (CFOI) program. Final 2014 CFOI data will be released in the late spring of 2016.
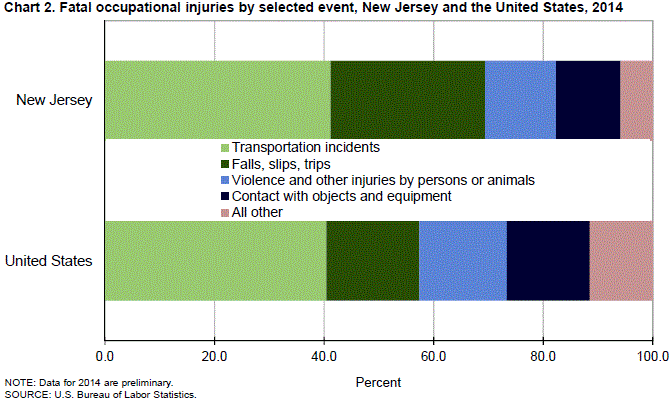
Of the 85 fatal work injuries reported in New Jersey in 2014, 35 resulted from transportation incidents and 24 from falls, slips, or trips. Together, these two major categories accounted for over two-thirds of all fatal work injuries reported in the state. (See table 1.) Other major event categories each reported 11 or fewer deaths. Within transportation incidents, roadway incidents involving motorized land vehicles was the most frequent type of workplace fatality with 18 deaths, followed by pedestrian vehicular incidents with 13 deaths. In the falls, slips, or trips category, 19 of the 24 deaths occurred as a result of falls to lower levels. (Note that roadway incident counts presented in this release are expected to rise when updated 2014 data are released in the late spring of 2016 because key source documentation detailing specific transportation-related incidents has not yet been received.)
In the United States, transportation incidents were also the most frequent fatal workplace event in 2014, accounting for 40 percent of fatal work injuries. In New Jersey, transportation incidents accounted for a similar share of the state’s fatalities, 41 percent. (See chart 2.) Falls, slips, or trips was the second most frequent type of event nationally, with 17 percent of work-related fatalities; the share in New Jersey was 28 percent. Violence and other injuries by persons or animals accounted for 16 percent of the nation’s workplace fatalities, and contact with objects or equipment accounted for 15 percent, while in the state, these events were responsible for 13 and 12 percent of workplace fatalities, respectively.
Additional highlights:Background of the program. The Census of Fatal Occupational Injuries, part of the BLS occupational safety and health statistics program, compiles a count of all fatal work injuries occurring in the United States during the calendar year. The program uses diverse state, federal, and independent data sources to identify, verify, and describe fatal work injuries. This ensures counts are as complete and accurate as possible.
For technical information about the CFOI program, please go to the BLS Handbook of Methods on the BLS web site at www.bls.gov/opub/hom/pdf/homch9.pdf.
Federal/State agency coverage. The Census of Fatal Occupational Injuries includes data for all fatal work injuries, whether the decedent was working in a job covered by the Occupational Safety and Health Administration (OSHA) or other federal or state agencies or was outside the scope of regulatory coverage. Thus, any comparison between the BLS fatality census counts and those released by other agencies should take into account the different coverage requirements and definitions being used by each agency.
Acknowledgments. The Bureau of Labor Statistics appreciates the efforts of all federal, state, local, and private sector entities that submitted source documents used to identify fatal work injuries.
Information in this release will be made available to sensory impaired individuals upon request. Voice phone: (202) 691-5200; Federal Relay Service: (800) 877-8339.
| Event or exposure (1) | 2013 (2) | 2014 (p) | |
|---|---|---|---|
| Number | Number | Percent | |
Total | 102 | 85 | 100 |
Violence and other injuries by persons or animals | 28 | 11 | 13 |
Intentional injury by person | 27 | 9 | 11 |
Homicides (Intentional injury by other person) | 16 | 5 | 6 |
Shooting by other person--intentional | 15 | 5 | 6 |
Suicides (Self-inflicted injury--intentional) | 11 | 4 | 5 |
Hanging, strangulation, asphyxiation--intentional self-harm | -- | 4 | 5 |
Transportation incidents | 37 | 35 | 41 |
Pedestrian vehicular incident | 11 | 13 | 15 |
Pedestrian struck by vehicle in roadway | 6 | 5 | 6 |
Pedestrian struck by forward-moving vehicle in roadway | 5 | 5 | 6 |
Pedestrian struck by vehicle on side of road | -- | 4 | 5 |
Pedestrian struck by forward-moving vehicle on side of road | -- | 4 | 5 |
Roadway incidents involving motorized land vehicle | 18 | 18 | 21 |
Roadway collision with other vehicle | 12 | 12 | 14 |
Roadway collision--moving in same direction | 5 | 4 | 5 |
Roadway collision--moving and standing vehicle in roadway | -- | 5 | 6 |
Roadway collision--moving and standing vehicle on side of roadway | 3 | 1 | 1 |
Roadway collision with object other than vehicle | 6 | 4 | 5 |
Vehicle struck object or animal on side of roadway | 5 | 4 | 5 |
Struck by shifting load during transport, roadway | -- | 1 | 1 |
Nonroadway incident involving motorized land vehicles | 4 | 3 | 4 |
Fires and explosions | -- | 3 | 4 |
Fires | -- | 3 | 4 |
Other structural fire without collapse | -- | 2 | 2 |
Falls, slips, trips | 16 | 24 | 28 |
Falls on same level | 4 | 5 | 6 |
Falls to lower level | 11 | 19 | 22 |
Other fall to lower level | 9 | 18 | 21 |
Other fall to lower level 6 to 10 feet | -- | 3 | 4 |
Other fall to lower level 11 to 15 feet | -- | 5 | 6 |
Other fall to lower level 16 to 20 feet | 1 | 3 | 4 |
Other fall to lower level 21 to 25 feet | -- | 3 | 4 |
Exposure to harmful substances or environments | 8 | -- | -- |
Contact with objects and equipment | 11 | 10 | 12 |
Struck by object or equipment | 11 | 6 | 7 |
Struck by falling object or equipment--other than powered vehicle | 3 | 3 | 4 |
Struck, caught, or crushed in collapsing structure, equipment, or material | -- | 4 | 5 |
Excavation or trenching cave-in | -- | 2 | 2 |
Footnotes: | |||
Note: Totals for major categories may include subcategories not shown separately. Percentages may not add to totals because of rounding. CFOI fatality counts exclude illness-related deaths unless precipitated by an injury event. Dashes indicate no data reported or data that do not meet publication guidelines. | |||
| Industry (1) | 2013 (2) | 2014 (p) | |
|---|---|---|---|
| Number | Number | Percent | |
Total | 102 | 85 | 100 |
Private industry | 93 | 74 | 87 |
Construction | 15 | 22 | 26 |
Construction | 15 | 22 | 26 |
Construction of buildings | -- | 3 | 4 |
Heavy and civil engineering construction | 4 | 2 | 2 |
Specialty trade contractors | 11 | 17 | 20 |
Manufacturing | 5 | 6 | 7 |
Manufacturing | 5 | 6 | 7 |
Nonmetallic mineral product manufacturing | 1 | 4 | 5 |
Trade, transportation, and utilities | 42 | 28 | 33 |
Wholesale trade | 5 | 3 | 4 |
Merchant wholesalers, nondurable goods | 1 | 1 | 1 |
Retail trade | 14 | 6 | 7 |
Building material and garden equipment and supplies dealers | 1 | 1 | 1 |
Gasoline stations | 5 | 1 | 1 |
General merchandise stores | 2 | 1 | 1 |
Transportation and warehousing | 21 | 19 | 22 |
Truck transportation | 9 | 12 | 14 |
Transit and ground passenger transportation | 3 | 5 | 6 |
Professional and business services | 8 | 11 | 13 |
Professional and technical services | 1 | 3 | 4 |
Professional, scientific, and technical services | 1 | 3 | 4 |
Administrative and waste services | 7 | 8 | 9 |
Administrative and support services | 7 | 6 | 7 |
Other services, except public administration | 7 | 2 | 2 |
Other services, except public administration | 7 | 2 | 2 |
Repair and maintenance | 3 | 1 | 1 |
Personal and laundry services | 3 | 1 | 1 |
Government (3) | 9 | 11 | 13 |
Local government | 5 | 9 | 11 |
Footnotes: | |||
Note: Totals for major categories may include subcategories not shown separately. Percentages may not add to totals because of rounding. CFOI fatality counts exclude illness-related deaths unless precipitated by an injury event. Dashes indicate no data reported or data that do not meet publication criteria. | |||
| Occupation (1) | 2013 (2) | 2014 (p) | |
|---|---|---|---|
| Number | Number | Percent | |
Total | 102 | 85 | 100 |
Management occupations | 3 | 3 | 4 |
Arts, design, entertainment, sports, and media occupations | 1 | 1 | 1 |
Entertainers and performers, sports and related workers | 1 | 1 | 1 |
Athletes, coaches, umpires, and related workers | 1 | 1 | 1 |
Coaches and scouts | -- | 1 | 1 |
Protective service occupations | 4 | 6 | 7 |
Supervisors of protective service workers | -- | 2 | 2 |
First-line supervisors of fire fighting and prevention workers | -- | 2 | 2 |
Law enforcement workers | 2 | 3 | 4 |
Police officers | 1 | 3 | 4 |
Police and sheriff's patrol officers | 1 | 3 | 4 |
Building and grounds cleaning and maintenance occupations | 7 | 7 | 8 |
Grounds maintenance workers | 3 | 3 | 4 |
Grounds maintenance workers | 3 | 3 | 4 |
Landscaping and groundskeeping workers | -- | 1 | 1 |
Sales and related occupations | 7 | -- | -- |
Supervisors of sales workers | 6 | 1 | 1 |
First-line supervisors of sales workers | 6 | 1 | 1 |
First-line supervisors of retail sales workers | 6 | 1 | 1 |
Construction and extraction occupations | 11 | 21 | 25 |
Supervisors of construction and extraction workers | 3 | 4 | 5 |
First-line supervisors of construction trades and extraction workers | 3 | 4 | 5 |
Construction trades workers | 8 | 14 | 16 |
Construction laborers | -- | 4 | 5 |
Construction equipment operators | -- | 1 | 1 |
Operating engineers and other construction equipment operators | -- | 1 | 1 |
Roofers | 3 | 3 | 4 |
Installation, maintenance, and repair occupations | 13 | -- | -- |
Vehicle and mobile equipment mechanics, installers, and repairers | -- | -- | -- |
Bus and truck mechanics and diesel engine specialists | -- | 2 | 2 |
Production occupations | 3 | 3 | 4 |
Transportation and material moving occupations | 41 | 33 | 39 |
Supervisors, transportation and material moving workers | -- | 4 | 5 |
Motor vehicle operators | 23 | 22 | 26 |
Bus drivers | -- | 1 | 1 |
Bus drivers, school or special client | -- | 1 | 1 |
Driver/sales workers and truck drivers | 19 | 17 | 20 |
Heavy and tractor-trailer truck drivers | 13 | 15 | 18 |
Taxi drivers and chauffeurs | 3 | 3 | 4 |
Other transportation workers | 5 | 1 | 1 |
Material moving workers | 9 | 6 | 7 |
Dredge, excavating, and loading machine operators | -- | 1 | 1 |
Excavating and loading machine and dragline operators | -- | 1 | 1 |
Laborers and material movers, hand | 5 | 4 | 5 |
Footnotes: | |||
Note: Totals for major categories may include subcategories not shown separately. Percentages may not add to totals because of rounding. CFOI fatality counts exclude illness-related deaths unless precipitated by an injury event. Dashes indicate no data reported or data that do not meet publication criteria. | |||
| Worker characteristics | 2013 (1) | 2014 (p) | |
|---|---|---|---|
| Number | Number | Percent | |
Total | 102 | 85 | 100 |
Employee status | |||
Wage and salary (2) | 76 | 68 | 80 |
Self-employed (3) | 26 | 17 | 20 |
Gender | |||
Men | 97 | 78 | 92 |
Women | 5 | 7 | 8 |
Age (4) | |||
20 to 24 years | 7 | 9 | 11 |
25 to 34 years | 15 | 10 | 12 |
35 to 44 years | 22 | 15 | 18 |
45 to 54 years | 24 | 21 | 25 |
55 to 64 years | 22 | 19 | 22 |
65 years and over | 11 | 11 | 13 |
Race or ethnic origin (5) | |||
White, non-Hispanic | 54 | 41 | 48 |
Black or African-American, non-Hispanic | 19 | 10 | 12 |
Hispanic or Latino | 20 | 30 | 35 |
Asian, non-Hispanic | 9 | 3 | 4 |
Footnotes: | |||
Note: Totals for major categories may include subcategories not shown separately. Percentages may not add to totals because of rounding. CFOI fatality counts exclude illness-related deaths unless precipitated by an injury event. Dashes indicate no data reported or data that do not meet publication criteria. | |||
Last Modified Date: Tuesday, December 08, 2015