An official website of the United States government
An official website of the United States government
The .gov means it's official.
Federal government websites often end in .gov or .mil. Before sharing sensitive information,
make sure you're on a federal government site.
The site is secure.
The
https:// ensures that you are connecting to the official website and that any
information you provide is encrypted and transmitted securely.
15-727-BOS
Wednesday, April 22, 2015
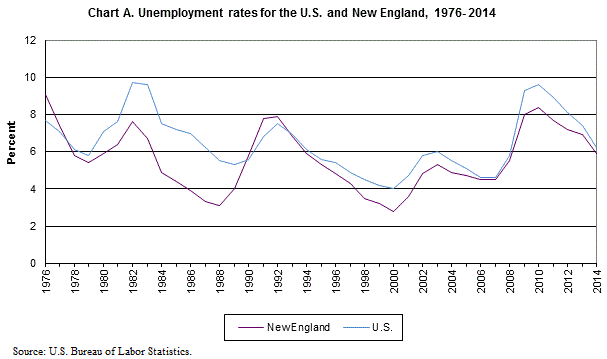
The annual average unemployment rate in New England, at 5.9 percent in 2014, was down 1.0 percentage point over the year, the U.S. Bureau of Labor Statistics reported today. Nationally the unemployment rate fell 1.2 percentage points, to 6.2 percent in 2014. (See table 1.) Regional Commissioner Deborah A. Brown noted that New England’s unemployment rate was not measurably different than the national average in 2014. The jobless rate in New England has rarely exceeded the U.S. average in the 38 years this data has been collected. (See chart A.)
New England is 1 of 9 geographic divisions in the United States. Jobless rates in the divisions ranged from a low of 4.6 percent in the West North Central to a high of 7.2 percent in the Pacific in 2014. Three divisions, the West North Central, West South Central, and Mountain recorded annual average unemployment rates that were significantly lower than that for the nation. Two divisions had rates significantly above the U.S. average--the East South Central and the Pacific. (See table 2.)
All nine geographic divisions reported statistically significant over-the-year unemployment rate decreases in 2014. The largest of these occurred in the East North Central (-1.7 percentage points) followed by the Middle Atlantic (-1.5 points).
Three of the six states that make up the New England division had jobless rates appreciably different from the U.S. average in 2014. Vermont (4.1 percent) and New Hampshire (4.3 percent) had rates significantly lower than that for the nation. In contrast, Rhode Island (7.7 percent) posted the highest unemployment rate in New England and was among the highest jobless rates nationwide. Massachusetts, Connecticut, and Maine posted unemployment rates that were not measurably different than that for the nation in 2014. (See table 1.)
Annual average unemployment rates decreased from 2013 to 2014 in all 50 states and the District of Columbia. This was the first year since 1984 in which all states and the District had over-the-year rate declines. In New England, over-the-year rate declines ranged from 1.6 percentage points in Rhode Island to 0.3 percentage point in Vermont. Jobless rate declines from 2013 to 2014 in the other New England states ranged from 0.8 to 1.1 percentage points.
This release presents labor force and unemployment data from the Current Population Survey (CPS) and the Local Area Unemployment Statistics (LAUS) program. Estimates for the U.S. are obtained directly from the CPS, which is a monthly sample survey of approximately 60,000 households nationwide that is conducted for the Bureau of Labor Statistics (BLS) by the Census Bureau. All subnational estimates presented in this release were derived from updated time-series models with monthly benchmarking to national Current Population Survey (CPS) estimates. Subnational data reflect revised population controls and model reestimation. Historical data were revised back to 2010. Data for regions, divisions, states, and the District of Columbia are available back to 1976.
The LAUS program produces data for the nine geographic divisions in the United States: New England, Middle Atlantic, South Atlantic, East South Central, West South Central, East North Central, West North Central, Mountain, and Pacific. Data for all divisions, as well as the 50 states, are available in the Regional and State Unemployment release (www.bls.gov/lau/home.htm#news). Analysis in this news release reflects the use of model-based error measures when making comparisons with the U.S. and the prior year. BLS uses a 90-percent confidence level in determining whether changes or differences in subnational unemployment rates are statistically significant. Model-based error measures are available on the BLS Web site at www.bls.gov/lau/lastderr.htm.
This information will be made available to sensory impaired individuals upon request. Voice phone: (202) 691-5200, Federal Relay Services: 1-800-877-8339.
| Area | Civilian labor force | Employed | Unemployed | Unemployment rate | Error range of rate, 2014(1) | ||||
|---|---|---|---|---|---|---|---|---|---|
| 2013 | 2014 | 2013 | 2014 | 2013 | 2014 | 2013 | 2014 | ||
United States | 155,389 | 155,922 | 143,929 | 146,305 | 11,460 | 9,617 | 7.4 | 6.2 | 6.1 - 6.2 |
New England | 7,735 | 7,785 | 7,202 | 7,327 | 533 | 458 | 6.9 | 5.9 | 5.6 - 6.2 |
Connecticut | 1,869 | 1,885 | 1,724 | 1,760 | 145 | 125 | 7.7 | 6.6 | 6.1 - 7.1 |
Maine | 707 | 699 | 660 | 659 | 47 | 40 | 6.6 | 5.7 | 5.2 - 6.2 |
Massachusetts | 3,509 | 3,557 | 3,272 | 3,353 | 237 | 205 | 6.7 | 5.8 | 5.2 - 6.3 |
New Hampshire | 742 | 741 | 704 | 709 | 38 | 32 | 5.1 | 4.3 | 3.9 - 4.7 |
Rhode Island | 557 | 553 | 505 | 511 | 52 | 42 | 9.3 | 7.7 | 7.1 - 8.2 |
Vermont | 351 | 349 | 336 | 335 | 16 | 14 | 4.4 | 4.1 | 3.7 - 4.5 |
Footnotes | |||||||||
| Census region and division | Civilian labor force | Employed | Unemployed | Unemployment rate | Error range of rate, 2014(1) | ||||
|---|---|---|---|---|---|---|---|---|---|
| 2013 | 2014 | 2013 | 2014 | 2013 | 2014 | 2013 | 2014 | ||
Northeast | 28,343 | 28,251 | 26,221 | 26,518 | 2,121 | 1,733 | 7.5 | 6.1 | 6.0 - 6.3 |
New England | 7,735 | 7,785 | 7,202 | 7,327 | 533 | 458 | 6.9 | 5.9 | 5.6 - 6.2 |
Middle Atlantic | 20,608 | 20,466 | 19,019 | 19,191 | 1,589 | 1,275 | 7.7 | 6.2 | 6.0 - 6.5 |
South | 56,781 | 56,996 | 52,792 | 53,580 | 3,989 | 3,416 | 7.0 | 6.0 | 5.9 - 6.1 |
South Atlantic | 30,078 | 30,240 | 27,897 | 28,359 | 2,181 | 1,881 | 7.3 | 6.2 | 6.0 - 6.4 |
East South Central | 8,581 | 8,403 | 7,909 | 7,830 | 672 | 573 | 7.8 | 6.8 | 6.5 - 7.2 |
West South Central | 18,122 | 18,353 | 16,987 | 17,392 | 1,135 | 962 | 6.3 | 5.2 | 5.0 - 5.5 |
Midwest | 34,301 | 34,443 | 31,831 | 32,429 | 2,471 | 2,014 | 7.2 | 5.8 | 5.7 - 6.0 |
East North Central | 23,286 | 23,319 | 21,390 | 21,817 | 1,896 | 1,502 | 8.1 | 6.4 | 6.2 - 6.7 |
West North Central | 11,016 | 11,124 | 10,441 | 10,611 | 575 | 512 | 5.2 | 4.6 | 4.4 - 4.8 |
West | 36,189 | 36,529 | 33,293 | 34,057 | 2,896 | 2,473 | 8.0 | 6.8 | 6.6 - 6.9 |
Mountain | 11,130 | 11,252 | 10,352 | 10,601 | 777 | 652 | 7.0 | 5.8 | 5.5 - 6.0 |
Pacific | 25,059 | 25,277 | 22,941 | 23,456 | 2,119 | 1,821 | 8.5 | 7.2 | 7.0 - 7.4 |
Footnotes Regions are defined as the four Census regions, comprised as follows: Northeast Region includes the New England Division - Connecticut, Maine, Massachusetts, New Hampshire, Rhode Island, and Vermont; and the Middle Atlantic Division - New Jersey, New York, and Pennsylvania. South Region includes the South Atlantic Division - Delaware, District of Columbia, Florida, Georgia, Maryland, North Carolina, South Carolina, Virginia, and West Virginia; East South Central Division - Alabama, Kentucky, Mississippi, and Tennessee; and West South Central Division - Arkansas, Louisiana, Oklahoma, and Texas. Midwest Region includes the East North Central Division - Illinois, Indiana, Michigan, Ohio, and Wisconsin; and the West North Central Division - Iowa, Kansas, Minnesota, Missouri, Nebraska, North Dakota, and South Dakota. West Region includes the Mountain Division - Arizona, Colorado, Idaho, Montana, Nevada, New Mexico, Utah, and Wyoming; and the Pacific Division - Alaska, California, Hawaii, Oregon, and Washington. | |||||||||
Last Modified Date: Wednesday, April 22, 2015