An official website of the United States government
An official website of the United States government
The .gov means it's official.
Federal government websites often end in .gov or .mil. Before sharing sensitive information,
make sure you're on a federal government site.
The site is secure.
The
https:// ensures that you are connecting to the official website and that any
information you provide is encrypted and transmitted securely.
25-1603-BOS
Thursday, December 18, 2025
The Consumer Price Index for All Urban Consumers (CPI-U) for Boston-Cambridge-Newton was down 0.4 percent for the two months ending in November 2025, the U.S. Bureau of Labor Statistics (BLS) reported today. Acting Regional Commissioner Michael G. Phinney noted that the all items less food and energy index and the food index decreased, while energy prices increased. (Data in this report are not seasonally adjusted. Accordingly, month-to-month changes may reflect the impact of seasonal influences.)
BLS did not collect survey data for October 2025 due to a lapse in appropriations. BLS was unable to retroactively collect these data. For a few indexes, BLS uses nonsurvey data sources instead of survey data to make the index calculations. BLS was able to retroactively acquire most of the nonsurvey data for October.
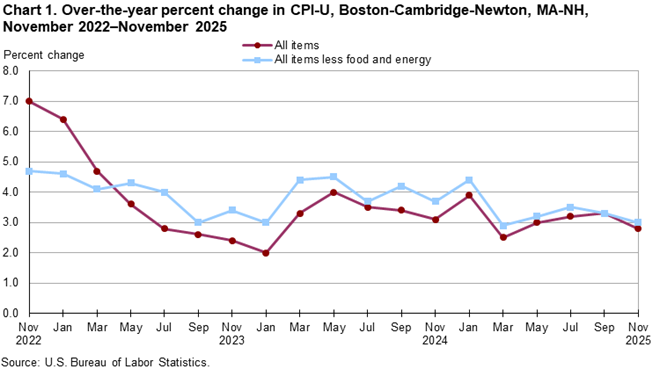
The Boston area all items CPI-U increased 2.8 percent for the 12 months ending in November. The index for all items less food and energy rose 3.0 percent. Over the same period, the indexes for food and energy increased 2.1 percent and 0.7 percent, respectively.
FoodThe food index declined 0.3 percent from September to November. A 1.1-percent decrease in prices for food away from home included lower prices for limited-service meals and snacks. In contrast, prices for food at home (grocery store purchases) rose 0.3 percent, with higher prices in 4 of the 6 major grocery store food groups.
Over the year, the food index rose 2.1 percent. Away-from-home food prices increased 5.2 percent, while at-home food prices decreased 0.4 percent. Four of the six major grocery store food group indexes declined over the year.
EnergyThe energy index increased 2.1 percent over the two-month pricing period. Gasoline prices declined 2.6 percent.
From November 2024 to November 2025, the energy index increased 0.7 percent. Gasoline prices edged down 0.2 percent.
All items less food and energyThe index for all items less food and energy declined 0.6 percent from September to November. Apparel prices, which are often down over this period, fell 12.4 percent. Airline fares also declined. Additionally, lower prices were recorded for medical care (-0.9 percent) and for shelter (-0.2 percent). Within shelter, prices for lodging away from home fell, while prices rose for owners’ equivalent rent (+0.5 percent) and for rent of primary residence (+0.7 percent). In contrast, prices rose for education and communication (+0.7 percent) and for other goods and services (+1.5 percent).
For the year ended in November 2025, the index for all items less food and energy increased 3.0 percent. The shelter index (+4.0 percent) was the largest contributor to the increase, due in part to increases in owners’ equivalent rent (+4.4 percent) and rent of primary residence (+3.8 percent). Other categories with increases included tuition, other school fees, and childcare, which climbed 6.2 percent, the largest over-the-year increase recorded since the series start in 2018.
BLS did not collect survey data for October 2025 due to a lapse in appropriations. BLS was unable to retroactively collect these data. For a few indexes, BLS uses nonsurvey data sources instead of survey data to make the index calculations. BLS was able to retroactively acquire most of the nonsurvey data for October. CPI data collection resumed on November 14, 2025.
Additional information about the impact of the shutdown on CPI data is available online.
With the release of November 2025 data on December 18, 2025, the Bureau of Labor Statistics (BLS) removed long-term care (LTC) insurance from the health insurance index. There have been changes in the market for LTC insurance that now make it out of scope and ineligible for pricing in the CPI market basket.
The Consumer Price Index for December 2025 is scheduled to be released on Tuesday, January 13, 2026, at 8:30 a.m. (ET).
The Consumer Price Index (CPI) is a measure of the average change in prices over time in a fixed market basket of goods and services. The Consumer Price Index for Boston is published bi-monthly. The set of components and sub-aggregates published for regional and metropolitan indexes is more limited than at the U.S. city average level; these indexes are byproducts of the national CPI program. Each local index has a much smaller sample size than the national or regional indexes and is, therefore, subject to substantially more sampling and other measurement error. As a result, local-area indexes are more volatile than the national or regional indexes. In addition, local indexes are not adjusted for seasonal influences. NOTE: Area indexes do not measure differences in the level of prices between cities; they only measure the average change in prices for each area since the base period.
The Boston-Cambridge-Newton, MA-NH Core Based Statistical Area includes Essex, Middlesex, Norfolk, Plymouth, and Suffolk Counties in Massachusetts and Rockingham and Strafford Counties in New Hampshire.
Refer to the national CPI news release technical note or the Handbook of Methods for more information.
Information in this release will be made available to individuals with sensory impairments upon request. Voice phone: (202) 691-5200; Telecommunications Relay Service: 7-1-1.
| Expenditure category | Indexes | Percent change from: | |||||
|---|---|---|---|---|---|---|---|
| Historical data | Sep. 2025 | Oct. 2025 | Nov. 2025 | Nov. 2024 | Sep. 2025 | Oct. 2025 | |
All items | 349.271 | - | 347.892 | 2.8 | -0.4 | - | |
All items (1967=100) | 1,015.165 | - | 1,011.157 | - | - | - | |
Food and beverages | 357.818 | - | 356.608 | 2.2 | -0.3 | - | |
Food | 362.556 | - | 361.306 | 2.1 | -0.3 | - | |
Food at home | 314.423 | - | 315.369 | -0.4 | 0.3 | - | |
Cereals and bakery products | 375.799 | - | 383.673 | -0.2 | 2.1 | - | |
Meats, poultry, fish, and eggs | 337.027 | - | 334.630 | -2.1 | -0.7 | - | |
Dairy and related products | 345.404 | - | 349.596 | -3.5 | 1.2 | - | |
Fruits and vegetables | 371.344 | - | 364.069 | -6.6 | -2.0 | - | |
Nonalcoholic beverages and beverage materials(1) | 223.957 | - | 227.299 | 9.1 | 1.5 | - | |
Other food at home | 246.571 | - | 248.149 | 2.3 | 0.6 | - | |
Food away from home | 449.002 | - | 444.093 | 5.2 | -1.1 | - | |
Alcoholic beverages | 310.491 | - | 309.734 | 3.4 | -0.2 | - | |
Housing | 384.173 | - | 384.811 | 3.7 | 0.2 | - | |
Shelter | 455.859 | - | 455.109 | 4.0 | -0.2 | - | |
Rent of primary residence | 476.913 | - | 480.236 | 3.8 | 0.7 | - | |
Owners' equiv. rent of residences(2) | 491.205 | - | 493.672 | 4.4 | 0.5 | - | |
Owners' equiv. rent of primary residence(2) | 491.205 | - | 493.672 | 4.4 | 0.5 | - | |
Household furnishings and operations | 150.244 | - | 149.907 | 2.5 | -0.2 | - | |
Apparel | 142.294 | - | 124.674 | -7.8 | -12.4 | - | |
Transportation | 240.390 | - | 237.665 | 2.8 | -1.1 | - | |
Private transportation | 247.485 | - | 247.725 | 2.7 | 0.1 | - | |
New and used motor vehicles(3) | 141.252 | - | 141.060 | 1.4 | -0.1 | - | |
New vehicles(1) | 241.187 | - | 240.780 | 0.4 | -0.2 | - | |
Used cars and trucks(1) | 434.114 | - | 433.253 | 3.6 | -0.2 | - | |
Motor fuel | 276.172 | - | 268.902 | -0.2 | -2.6 | - | |
Gasoline (all types) | 273.491 | 267.720 | 266.286 | -0.2 | -2.6 | -0.5 | |
Unleaded regular(4) | 261.490 | 255.497 | 254.092 | -0.3 | -2.8 | -0.5 | |
| 313.519 | 309.723 | 308.328 | 0.7 | -1.7 | -0.5 | ||
Unleaded premium(4) | 313.826 | 310.028 | 308.580 | 0.5 | -1.7 | -0.5 | |
Medical care | 769.718 | - | 762.945 | 0.7 | -0.9 | - | |
Recreation(3) | 118.291 | - | 118.545 | 1.7 | 0.2 | - | |
Education and communication(3) | 182.054 | - | 183.374 | 3.0 | 0.7 | - | |
Tuition, other school fees, and childcare(1) | 1,646.548 | - | 1,654.043 | 6.2 | 0.5 | - | |
Other goods and services | 689.340 | - | 699.606 | 6.0 | 1.5 | - | |
Footnotes | |||||||
- Data not available. | |||||||
| Special aggregate index | Indexes | Percent change from: | |||||
|---|---|---|---|---|---|---|---|
| Historical data | Sep. 2025 | Oct. 2025 | Nov. 2025 | Nov. 2024 | Sep. 2025 | Oct. 2025 | |
All items | 349.271 | - | 347.892 | 2.8 | -0.4 | - | |
Food | 362.556 | - | 361.306 | 2.1 | -0.3 | - | |
Energy | 314.305 | - | 321.014 | 0.7 | 2.1 | - | |
All items less food and energy | 357.981 | - | 355.997 | 3.0 | -0.6 | - | |
All items less energy | 357.224 | - | 355.353 | 2.9 | -0.5 | - | |
All items less medical care | 333.179 | - | 331.985 | 2.9 | -0.4 | - | |
All items less shelter | 308.404 | - | 306.722 | 2.0 | -0.5 | - | |
Commodities | 232.200 | - | 228.771 | 0.5 | -1.5 | - | |
Commodities less food | 176.476 | - | 172.263 | -0.8 | -2.4 | - | |
Commodities less food & beverages | 171.118 | - | 166.823 | -1.0 | -2.5 | - | |
Durables | 119.585 | - | 118.224 | -1.0 | -1.1 | - | |
Nondurables | 291.584 | - | 286.997 | 0.9 | -1.6 | - | |
Nondurables less food | 233.167 | - | 225.655 | -0.7 | -3.2 | - | |
Nondurables less food & beverages | 228.142 | - | 220.117 | -1.1 | -3.5 | - | |
Services | 454.972 | - | 455.383 | 3.8 | 0.1 | - | |
Services less rent of shelter(1) | 469.082 | - | 471.088 | 3.5 | 0.4 | - | |
Services less medical care services | 431.720 | - | 432.500 | 4.1 | 0.2 | - | |
- Data not available. | |||||||
Last Modified Date: Thursday, December 18, 2025