An official website of the United States government
An official website of the United States government
The .gov means it's official.
Federal government websites often end in .gov or .mil. Before sharing sensitive information,
make sure you're on a federal government site.
The site is secure.
The
https:// ensures that you are connecting to the official website and that any
information you provide is encrypted and transmitted securely.
26-577-BOS
Friday, March 27, 2026
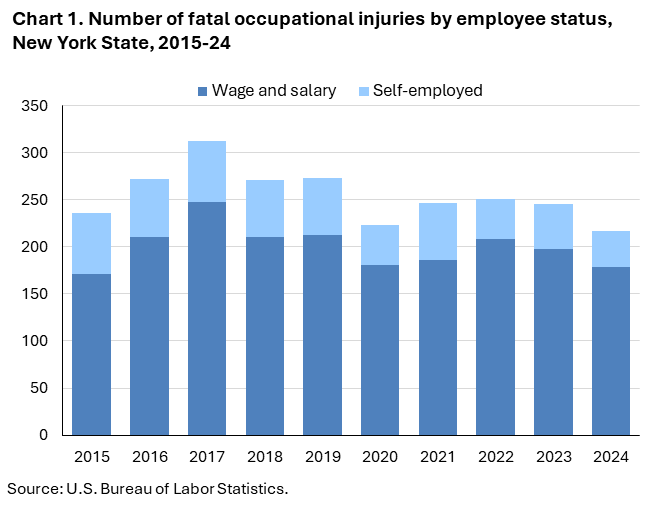
Fatal work injuries totaled 217 in 2024 for New York State (including New York City), the U.S. Bureau of Labor Statistics reported today. Acting Regional Commissioner Michael G. Phinney noted that the number of work-related fatalities in New York was down 11.8 percent from 246 in 2023. (See chart 1.) The fatal work injury rate was 2.4 fatalities per 100,000 full-time equivalent (FTE) workers in 2024, a decrease from a rate of 2.8 in 2023. Nationwide, a total of 5,070 fatal work injuries were recorded in 2024, a 4.0-percent decrease from 5,283 in 2023. These data are from the Census of Fatal Occupational Injuries (CFOI).
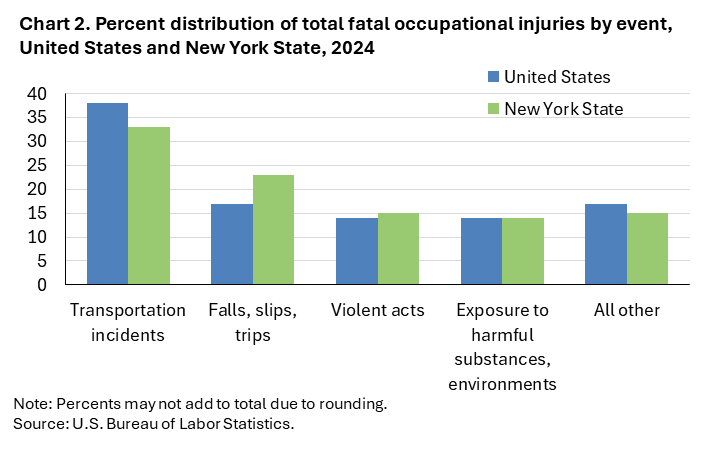
Fatal event or exposureTransportation incidents (72) were the most frequent type of fatal event in New York, accounting for 33 percent of all fatal work injuries. Nationally, the share was 38 percent. (See chart 2 and table 1.)
Falls, slips, and trips (49) accounted for 23 percent of workplace fatalities in New York; nationally, the share was 17 percent.
Exposure to harmful substances or environments resulted in 30 fatalities in 2024, down 19 over the year.
Private industry
The construction sector had 50 fatal workplace injuries, down from 60 the previous year. (See table 2.)
Of the 50 construction sector fatalities, 24 were the result of falls, slips, and trips.
The specialty trade contractors subsector accounted for 27 of the sector’s fatal workplace injuries.
The construction and extraction occupational group had 55 fatal workplace injuries, down 19 over the year. (See table 3.)
Falls, slips, and trips resulted in 24 of the 55 construction and extraction fatalities.
Construction trades workers accounted for 42 of the major group’s fatal workplace injuries.
Wage and salary workers accounted for 82 percent of fatal workplace injuries in New York; the self-employed comprised the remaining 18 percent. Nationally, wage and salary workers comprised 82 percent of fatalities. (See chart 1 and table 4.)
Males accounted for 88 percent of the fatal work injuries in New York and 92 percent nationally.
Workers 45 to 54 years old had a 30-percent decrease in worker fatalities from 56 in 2023 to 39 in 2024. Workers 55 to 64 years old had a 27-percent decline in work-related fatalities from 63 in 2023 to 46 in 2024.
White, non-Hispanic workers had the largest share (51 percent) of fatal workplace injuries in New York. This group accounted for 56 percent of all work fatalities for the nation. Hispanic or Latino workers accounted for 26 percent of fatal work injuries in New York. Nationwide, this group accounted for 24 percent of work-related deaths. Non-Hispanic Asian workers accounted for 11 percent of New York work-related fatalities, compared to 4 percent nationally.
Fatalities among White, non-Hispanic workers decreased 14 percent from 129 in 2023 to 111. Among Hispanic or Latino workers, fatal workplace injuries declined 13 percent from 64 in 2023 to 56 in 2024.
Background of the program. The Census of Fatal Occupational Injuries (CFOI), part of the Bureau of Labor Statistics (BLS) Occupational Safety and Health Statistics (OSHS) program, is a count of all fatalities resulting from workplace injuries occurring in the U.S. during the calendar year. For technical information and definitions for the CFOI, see the national CFOI release Technical notes, the BLS Handbook of Methods, and the CFOI definitions.
Acknowledgments. BLS thanks the New York State Department of Health and the NYC Department of Health and Mental Hygiene for their efforts in collecting accurate, comprehensive, and useful data on fatal work injuries. BLS also appreciates the efforts of all federal, state, local, and private sector entities that provided source documents used to identify fatal work injuries nationally. See the national CFOI release Technical Notes for details on cooperating entities.
If you are deaf, hard of hearing, or have a speech disability, please dial 7-1-1 to access telecommunications relay services.
| Event or Exposure (1) | 2023 | 2024 | |
|---|---|---|---|
| Number | Number | Percent (%) | |
All events and exposures | 246 | 217 | 100 |
Violent acts | -- | 33 | 15 |
Homicides (violent acts by other person) | -- | 19 | 9 |
Shooting by other person | -- | 11 | 5 |
Stabbing, cutting, slashing by other person | -- | 5 | 2 |
Hitting, kicking, beating by other person | -- | 3 | 1 |
Suicides (intentional self-harm) | -- | 14 | 6 |
Transportation incidents | 75 | 72 | 33 |
Aircraft incidents | 6 | 5 | 2 |
Non-motorized transport incidents | -- | -- | -- |
Pedal cycle incidents | -- | 3 | 1 |
Pedal cycle collision in roadway | -- | 3 | 1 |
Pedestrian incidents involving motorized land vehicles | -- | 21 | 10 |
Roadway incidents involving motorized land vehicle | -- | 36 | 17 |
Roadway collision with other vehicle(s) | -- | 21 | 10 |
Roadway collision with other vehicle(s)-intersecting, turning | 6 | 6 | 3 |
Roadway collision with other vehicle(s)-moving in same direction | -- | 7 | 3 |
Roadway collision with other vehicle(s)-moving in opposite directions, oncoming | 11 | 8 | 4 |
Nonroadway incidents involving motorized land vehicles | -- | 5 | 2 |
Explosions and fires | -- | -- | -- |
Falls, slips, trips | 54 | 49 | 23 |
Fall to lower level | -- | 35 | 16 |
Fall to lower level from collapsing structure or equipment | -- | -- | -- |
Fall to lower level from collapsing structure or equipment- 6 to 30 feet | -- | 3 | 1 |
Exposure to harmful substances, environments | 49 | 30 | 14 |
Exposure to electricity | -- | 3 | 1 |
Indirect exposure to electricity | 3 | 3 | 1 |
Indirect exposure to electricity- greater than 220 volts | 3 | 3 | 1 |
Exposure to harmful substances | 39 | -- | -- |
Contact incidents | -- | -- | -- |
Struck by propelled, falling, or suspended object | 14 | -- | -- |
Struck by falling object | 14 | -- | -- |
Overexertion, repetitive motion, and bodily condition | -- | -- | -- |
Footnotes: | |||
Note: The Census of Fatal Occupational Injuries (CFOI) has published data on fatal occupational injuries for the United States since 1992. During this time, the classification systems and definitions of many data elements have changed. See the CFOI Definitions page (www.bls.gov/iif/definitions/census-of-fatal-occupational-injuries-definitions.htm) for a more detailed description of each data element. Data for all years are revised and final. Totals for major categories may include subcategories not shown separately. Dashes indicate no data reported or data that do not meet publication criteria. CFOI fatal injury counts exclude illness-related deaths unless precipitated by an injury event. | |||
| Industry | 2023 | 2024 | |
|---|---|---|---|
| Number | Number | Percent (%) | |
Total | 246 | 217 | 100 |
Private industry (1) | 223 | 189 | 87 |
Natural resources and mining | 18 | 14 | 6 |
Agriculture, forestry, fishing and hunting | 18 | 14 | 6 |
Crop production | 7 | 6 | 3 |
Oilseed and grain farming | -- | 3 | 1 |
Animal production and aquaculture | 5 | 4 | 2 |
Cattle ranching and farming | 5 | 4 | 2 |
Construction | 60 | 50 | 23 |
Construction | 60 | 50 | 23 |
Construction of buildings | 14 | 12 | 6 |
Specialty trade contractors | 34 | 27 | 12 |
Foundation, structure, and building exterior contractors | -- | 13 | 6 |
Manufacturing | -- | -- | -- |
Trade, transportation, and utilities | -- | -- | -- |
Wholesale trade | -- | 11 | 5 |
Retail trade | 18 | -- | -- |
Motor vehicle and parts dealers | 4 | 5 | 2 |
Sporting goods, hobby, musical instrument, book, and miscellaneous retailers | -- | 1 | 0 |
Other miscellaneous retailers | -- | 1 | 0 |
Transportation and warehousing | 27 | 26 | 12 |
Truck transportation | -- | 6 | 3 |
General freight trucking | -- | 4 | 2 |
Transit and ground passenger transportation | -- | -- | -- |
Other transit and ground passenger transportation | -- | 5 | 2 |
Other transit and ground passenger transportation | -- | 5 | 2 |
Special needs transportation | -- | 4 | 2 |
Information | -- | -- | -- |
Financial activities | -- | -- | -- |
Professional and business services | 29 | -- | -- |
Professional, scientific, and technical services | 5 | -- | -- |
Administrative and support and waste management and remediation services | 24 | 15 | 7 |
Educational and health services | -- | -- | -- |
Health care and social assistance | 12 | 7 | 3 |
Leisure and hospitality | -- | -- | -- |
Arts, entertainment, and recreation | -- | -- | -- |
Amusement, gambling, and recreation industries | -- | 3 | 1 |
Other amusement and recreation industries | -- | 3 | 1 |
Accommodation and food services | -- | -- | -- |
Accommodation | -- | 1 | 0 |
Traveler accommodation | -- | 1 | 0 |
Hotels (except casino hotels) and motels | -- | 1 | 0 |
Food services and drinking places | -- | -- | -- |
Drinking places (alcoholic beverages) | -- | 1 | 0 |
Drinking places (alcoholic beverages) | -- | 1 | 0 |
Other services (except public administration) | 13 | 18 | 8 |
Other services (except public administration) | 13 | 18 | 8 |
Government (2) | 23 | 28 | 13 |
Federal government | -- | -- | -- |
State government | -- | 6 | 3 |
Local government | 20 | 20 | 9 |
Footnotes: | |||
Note: The Census of Fatal Occupational Injuries (CFOI) has published data on fatal occupational injuries for the United States since 1992. During this time, the classification systems and definitions of many data elements have changed. See the CFOI Definitions page (www.bls.gov/iif/definitions/census-of-fatal-occupational-injuries-definitions.htm) for a more detailed description of each data element. Data for all years are revised and final. Totals for major categories may include subcategories not shown separately. Dashes indicate no data reported or data that do not meet publication criteria. CFOI fatal injury counts exclude illness-related deaths unless precipitated by an injury event. | |||
| Occupation (1) | 2023 | 2024 | |
|---|---|---|---|
| Number | Number | Percent (%) | |
All occupations | 246 | 217 | 100 |
Management occupations | 21 | 10 | 5 |
Top executives | -- | 1 | 0 |
Chief executives | -- | 1 | 0 |
Chief executives | -- | 1 | 0 |
Other management occupations | -- | -- | -- |
Farmers, ranchers, and other agricultural managers | -- | 3 | 1 |
Farmers, ranchers, and other agricultural managers | -- | 3 | 1 |
Business and financial operations occupations | -- | -- | -- |
Computer and mathematical occupations | -- | -- | -- |
Architecture and engineering occupations | -- | -- | -- |
Life, physical, and social science occupations | -- | -- | -- |
Community and social service occupations | -- | -- | -- |
Legal occupations | -- | -- | -- |
Educational instruction and library occupations | -- | -- | -- |
Arts, design, entertainment, sports, and media occupations | -- | -- | -- |
Entertainers and performers, sports and related workers | -- | -- | -- |
Athletes, coaches, umpires, and related workers | -- | 1 | 0 |
Healthcare practitioners and technical occupations | 4 | -- | -- |
Healthcare support occupations | -- | -- | -- |
Protective service occupations | -- | -- | -- |
Food preparation and serving related occupations | 7 | -- | -- |
Food and beverage serving workers | -- | 3 | 1 |
Building and grounds cleaning and maintenance occupations | -- | 15 | 7 |
Personal care and service occupations | -- | -- | -- |
Entertainment attendants and related workers | -- | 3 | 1 |
Sales and related occupations | 6 | -- | -- |
Supervisors of sales workers | -- | 3 | 1 |
First-line supervisors of sales workers | -- | 3 | 1 |
Office and administrative support occupations | -- | -- | -- |
Farming, fishing, and forestry occupations | 7 | 8 | 4 |
Construction and extraction occupations | 74 | 55 | 25 |
Construction trades workers | 61 | 42 | 19 |
Construction laborers | 32 | 26 | 12 |
Construction laborers | 32 | 26 | 12 |
Installation, maintenance, and repair occupations | 16 | -- | -- |
Vehicle and mobile equipment mechanics, installers, and repairers | -- | -- | -- |
Automotive technicians and repairers | -- | 6 | 3 |
Automotive service technicians and mechanics | -- | 6 | 3 |
Production occupations | -- | -- | -- |
Transportation and material moving occupations | 48 | 44 | 20 |
Air transportation workers | -- | 4 | 2 |
Aircraft pilots and flight engineers | -- | 4 | 2 |
Motor vehicle operators | 29 | 31 | 14 |
Footnotes: | |||
Note: The Census of Fatal Occupational Injuries (CFOI) has published data on fatal occupational injuries for the United States since 1992. During this time, the classification systems and definitions of many data elements have changed. See the CFOI Definitions page (www.bls.gov/iif/definitions/census-of-fatal-occupational-injuries-definitions.htm) for a more detailed description of each data element. Data for all years are revised and final. Totals for major categories may include subcategories not shown separately. Dashes indicate no data reported or data that do not meet publication criteria. CFOI fatal injury counts exclude illness-related deaths unless precipitated by an injury event. | |||
| Demographic | 2023 | 2024 | |
|---|---|---|---|
| Number | Number | Percent (%) | |
Total | 246 | 217 | 100 |
Employee status | |||
Wage and salary workers (1) | 198 | 179 | 82 |
Self-employed (2) | 48 | 38 | 18 |
Sex | |||
Male | 220 | 192 | 88 |
Female | 25 | 25 | 12 |
Age (3) | |||
Under 16 years | -- | -- | -- |
16 to 17 years | -- | -- | -- |
18 to 19 years | -- | -- | -- |
20 to 24 years | -- | 10 | 5 |
25 to 34 years | 30 | 27 | 12 |
35 to 44 years | 49 | 54 | 25 |
45 to 54 years | 56 | 39 | 18 |
55 to 64 years | 63 | 46 | 21 |
65 years and over | 36 | 37 | 17 |
Race or ethnic origin (4) | |||
White, non-Hispanic | 129 | 111 | 51 |
Black or African-American, non-Hispanic | 34 | -- | -- |
Hispanic or Latino | 64 | 56 | 26 |
American Indian or Alaska Native, non-Hispanic | -- | -- | -- |
Asian, non-Hispanic | -- | 23 | 11 |
Native Hawaiian or Pacific Islander, non-Hispanic | -- | -- | -- |
Person of multiple races, non-Hispanic | -- | -- | -- |
Other or not reported, non-Hispanic | -- | -- | -- |
Footnotes: | |||
Note: The Census of Fatal Occupational Injuries (CFOI) has published data on fatal occupational injuries for the United States since 1992. During this time, the classification systems and definitions of many data elements have changed. See the CFOI Definitions page (www.bls.gov/iif/definitions/census-of-fatal-occupational-injuries-definitions.htm) for a more detailed description of each data element. Data for all years are revised and final. Totals for major categories may include subcategories not shown separately. Dashes indicate no data reported or data that do not meet publication criteria. CFOI fatal injury counts exclude illness-related deaths unless precipitated by an injury event. | |||
Last Modified Date: Friday, March 27, 2026