An official website of the United States government
An official website of the United States government
The .gov means it's official.
Federal government websites often end in .gov or .mil. Before sharing sensitive information,
make sure you're on a federal government site.
The site is secure.
The
https:// ensures that you are connecting to the official website and that any
information you provide is encrypted and transmitted securely.
25-282-BOS
Friday, February 28, 2025
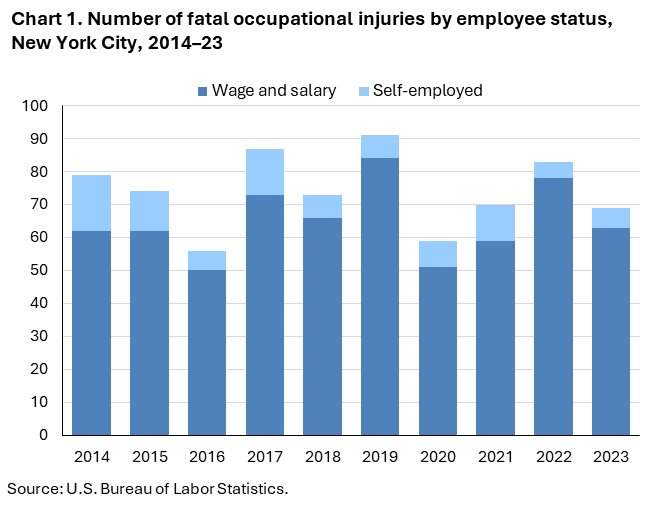
Fatal work injuries totaled 69 in 2023 for New York City, the U.S. Bureau of Labor Statistics reported today. Regional Commissioner William J. Sibley noted that the number of work-related fatalities in New York City was down from the previous year. (See chart 1.) Fatal occupational injuries in the city have ranged from a high of 191 in 1993 to a low of 56 in 2013 and 2016. Nationwide, a total of 5,283 fatal work injuries were recorded in 2023, a 3.7-percent decrease from 5,486 in 2022, according to the results from the Census of Fatal Occupational Injuries (CFOI).
Fatal event or exposureThe 2022 North American Industry Classification System (NAICS) and the updated Occupational Injury and Illness Classification System (OIICS) were implemented with the release of 2023 data. As a result of these changes, comparisons between 2023 CFOI data and previous years should be made with caution. Refer to the national release technical note for more information.
Background of the program. The Census of Fatal Occupational Injuries (CFOI), part of the Bureau of Labor Statistics (BLS) Occupational Safety and Health Statistics (OSHS) program, is a count of all fatalities resulting from workplace injuries occurring in the U.S. during the calendar year. For technical information and definitions for the CFOI, see the national CFOI release Technical notes, the BLS Handbook of Methods, and the CFOI definitions.
Acknowledgments. BLS thanks the NYC Department of Health and Mental Hygiene for their efforts in collecting accurate, comprehensive, and useful data on fatal work injuries. BLS also appreciates the efforts of all federal, state, local, and private sector entities that provided source documents used to identify fatal work injuries nationally. See the national CFOI release Technical Notes for details on cooperating entities.
Information in this release will be made available to individuals with sensory impairments upon request. Voice phone: (202) 691-5200; Telecommunications Relay Service: 7-1-1.
| Event or Exposure (1) | Number | Percent (%) |
|---|---|---|
|
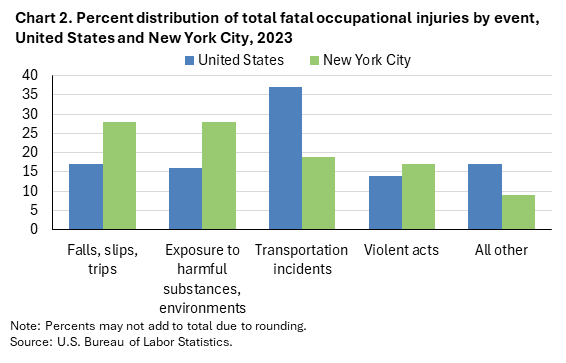
All events and exposures |
69 | 100 |
|
Violent acts |
12 | 17 |
|
Homicides (violent acts by other person) |
5 | 7 |
|
Shooting by other person |
3 | 4 |
|
Suicides (intentional self-harm) |
7 | 10 |
|
Intentional self-harm-- jump from building, structure |
3 | 4 |
|
Transportation incidents |
13 | 19 |
|
Falls, slips, trips |
19 | 28 |
|
Exposure to harmful substances, environments |
19 | 28 |
|
Exposure to harmful substances |
16 | 23 |
|
Drug, alcohol overdose |
16 | 23 |
|
Footnotes: |
||
|
NOTE: Data for all years are revised and final. Totals for major categories may include subcategories not shown separately. Dashes indicate no data reported or data that do not meet publication criteria. CFOI fatal injury counts exclude illness-related deaths unless precipitated by an injury event. |
||
| Industry | Number | Percentage (%) |
|---|---|---|
|
Total |
69 | 100 |
|
Private industry (1) |
61 | 88 |
|
Natural resources and mining |
-- | -- |
|
Construction |
24 | 35 |
|
Construction |
24 | 35 |
|
Construction of buildings |
7 | 10 |
|
Nonresidential building construction |
3 | 4 |
|
Heavy and civil engineering construction |
2 | 3 |
|
Highway, street, and bridge construction |
2 | 3 |
|
Highway, street, and bridge construction |
2 | 3 |
|
Specialty trade contractors |
10 | 14 |
|
Building equipment contractors |
4 | 6 |
|
Manufacturing |
-- | -- |
|
Trade, transportation, and utilities |
-- | -- |
|
Retail trade |
7 | 10 |
|
Food and beverage retailers |
4 | 6 |
|
Grocery and convenience retailers |
4 | 6 |
|
Transportation and warehousing |
7 | 10 |
|
Information |
-- | -- |
|
Financial activities |
-- | -- |
|
Professional and business services |
6 | 9 |
|
Administrative and support and waste management and remediation services |
6 | 9 |
|
Educational and health services |
-- | -- |
|
Health care and social assistance |
3 | 4 |
|
Leisure and hospitality |
-- | -- |
|
Other services (except public administration) |
4 | 6 |
|
Other services (except public administration) |
4 | 6 |
|
Government (2) |
8 | 12 |
|
Federal government |
-- | -- |
|
State government |
-- | -- |
|
Local government |
7 | 10 |
|
Footnotes: |
||
|
NOTE: Data for all years are revised and final. Totals for major categories may include subcategories not shown separately. Dashes indicate no data reported or data that do not meet publication criteria. CFOI fatal injury counts exclude illness-related deaths unless precipitated by an injury event. |
||
| Occupation (1) | Number | Percentage (%) |
|---|---|---|
|
All occupations |
69 | 100 |
|
Management occupations |
3 | 4 |
|
Food preparation and serving related occupations |
3 | 4 |
|
Sales and related occupations |
3 | 4 |
|
Construction and extraction occupations |
30 | 43 |
|
Construction trades workers |
22 | 32 |
|
Carpenters |
3 | 4 |
|
Carpenters |
3 | 4 |
|
Construction laborers |
14 | 20 |
|
Construction laborers |
14 | 20 |
|
Electricians |
3 | 4 |
|
Electricians |
3 | 4 |
|
Installation, maintenance, and repair occupations |
3 | 4 |
|
Transportation and material moving occupations |
9 | 13 |
|
Motor vehicle operators |
4 | 6 |
|
Footnotes: |
||
|
NOTE: Data for all years are revised and final. Totals for major categories may include subcategories not shown separately. Dashes indicate no data reported or data that do not meet publication criteria. CFOI fatal injury counts exclude illness-related deaths unless precipitated by an injury event. |
||
| Demographic | Number | Percentage (%) |
|---|---|---|
|
Total |
69 | 100 |
|
Employee status |
||
|
Wage and salary workers (1) |
63 | 91 |
|
Self-employed (2) |
6 | 9 |
|
Sex |
||
|
Male |
62 | 90 |
|
Female |
7 | 10 |
|
Age (3) |
||
|
25 to 34 years |
8 | 12 |
|
35 to 44 years |
10 | 14 |
|
45 to 54 years |
13 | 19 |
|
55 to 64 years |
27 | 39 |
|
65 years and over |
5 | 7 |
|
Race or ethnic origin (4) |
||
|
White, non-Hispanic |
14 | 20 |
|
Black or African-American, non-Hispanic |
17 | 25 |
|
Hispanic or Latino |
28 | 41 |
|
Footnotes: |
||
|
NOTE: Data for all years are revised and final. Totals for major categories may include subcategories not shown separately. Dashes indicate no data reported or data that do not meet publication criteria. CFOI fatal injury counts exclude illness-related deaths unless precipitated by an injury event. |
||
Last Modified Date: Friday, February 28, 2025