An official website of the United States government
An official website of the United States government
The .gov means it's official.
Federal government websites often end in .gov or .mil. Before sharing sensitive information,
make sure you're on a federal government site.
The site is secure.
The
https:// ensures that you are connecting to the official website and that any
information you provide is encrypted and transmitted securely.
25-391-BOS
Wednesday, March 19, 2025
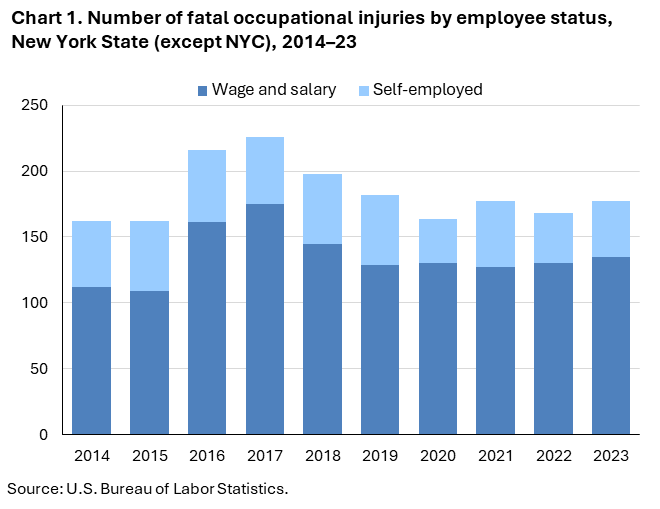
Fatal work injuries totaled 177 in 2023 for New York State (except New York City), the U.S. Bureau of Labor Statistics reported today. Regional commissioner William J. Sibley noted that the number of work-related fatalities in New York (except NYC) was up from the previous year. (See chart 1.) Fatal occupational injuries in the state have ranged from a high of 226 in 2017 to a low of 114 in 2010. Nationwide, a total of 5,283 fatal work injuries were recorded in 2023, a 3.7-percent decrease from 5,486 in 2022. These data are from the Census of Fatal Occupational Injuries (CFOI).
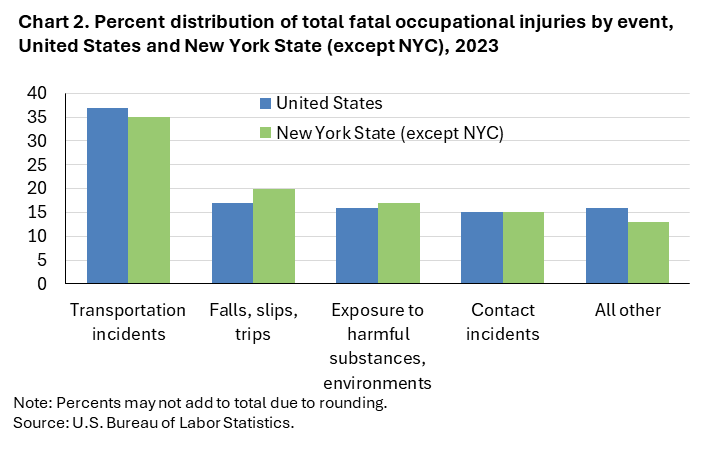
Fatal event or exposureTransportation incidents (62) were the most frequent type of fatal event in New York (except NYC), accounting for 35 percent of all fatal work injuries. Transportation incidents also accounted for the greatest share of fatal events in the United States (37 percent). (See chart 2 and table 1.)
The construction sector had the highest number of fatalities with 36. (See table 2.)
Of the 36 construction fatalities, 16 were the result of falls, slips, and trips.
The specialty trade contractors subsector accounted for 24 of the sector’s fatal workplace injuries.
Construction and extraction occupations had the highest number of fatal workplace injuries with 44. (See table 3.)
Falls, trips, and slips resulted in 15 of the construction and extraction fatalities.
Construction trades workers accounted for 39 of the major group’s fatal workplace injuries.
Wage and salary workers accounted for 76 percent of workplace fatalities in New York (except NYC); the self-employed comprised the remaining 24 percent. Nationally, wage and salary workers comprised 83 percent of fatalities. (See chart 1 and table 4.)
Males accounted for 89 percent of the fatal work injuries in New York (except NYC) and 91 percent nationally.
Workers 45 to 54 years old had the largest share (24 percent) of New York (except NYC) fatal work injuries. Nationally, this group’s share was 20 percent.
White, non-Hispanic workers had the largest share (65 percent) of fatal workplace injuries in New York (except NYC). This group was involved in 56 percent of all work fatalities for the nation. Hispanic or Latino workers accounted for 20 percent of workplace-related fatal injuries in New York (except NYC).
The 2022 North American Industry Classification System (NAICS) and the updated Occupational Injury and Illness Classification System (OIICS) were implemented with the release of 2023 data. As a result of these changes, comparisons between 2023 CFOI data and previous years should be made with caution. Refer to the national release technical note for more information.
Background of the program. The Census of Fatal Occupational Injuries (CFOI), part of the Bureau of Labor Statistics (BLS) Occupational Safety and Health Statistics (OSHS) program, is a count of all fatalities resulting from workplace injuries occurring in the U.S. during the calendar year. For technical information and definitions for the CFOI, see the national CFOI release Technical notes, the BLS Handbook of Methods, and the CFOI definitions.
Acknowledgments. BLS thanks the New York State Department of Health for their efforts in collecting accurate, comprehensive, and useful data on fatal work injuries. BLS also appreciates the efforts of all federal, state, local, and private sector entities that provided source documents used to identify fatal work injuries nationally. See the national CFOI release Technical Notes for details on cooperating entities.
Information in this release will be made available to individuals with sensory impairments upon request. Voice phone: (202) 691-5200; Telecommunications Relay Service: 7-1-1.
| Event or Exposure (1) | Number | Percent (%) |
|---|---|---|
|
All events and exposures |
177 | 100 |
|
Violent acts |
-- | -- |
|
Transportation incidents |
62 | 35 |
|
Aircraft incidents |
6 | 3 |
|
Pedestrian incidents involving motorized land vehicles |
9 | 5 |
|
Pedestrian struck by vehicle in nonroadway area |
5 | 3 |
|
Roadway incidents involving motorized land vehicle |
39 | 22 |
|
Roadway collision with other vehicle(s) |
21 | 12 |
|
Roadway collision with other vehicle(s)-intersecting, turning |
5 | 3 |
|
Roadway collision with other vehicle(s)-moving in opposite directions, oncoming |
11 | 6 |
|
Nonroadway incidents involving motorized land vehicles |
7 | 4 |
|
Explosions and fires |
-- | -- |
|
Falls, slips, trips |
35 | 20 |
|
Fall to lower level |
26 | 15 |
|
Other fall to lower level |
23 | 13 |
|
Other fall to lower level- 6 to 30 feet |
16 | 9 |
|
Slip, trip, stumble or fall on same level |
7 | 4 |
|
Fall on same level |
7 | 4 |
|
Exposure to harmful substances, environments |
30 | 17 |
|
Exposure to electricity |
3 | 2 |
|
Indirect exposure to electricity |
3 | 2 |
|
Indirect exposure to electricity- greater than 220 volts |
3 | 2 |
|
Exposure to harmful substances |
23 | 13 |
|
Contact incidents |
27 | 15 |
|
Struck by propelled, falling, or suspended object |
14 | 8 |
|
Struck by falling object |
14 | 8 |
|
Struck, caught, or compressed by running powered equipment |
9 | 5 |
|
Struck by rolling powered vehicle or machinery |
4 | 2 |
|
Footnotes: |
||
|
NOTE: Data for all years are revised and final. Totals for major categories may include subcategories not shown separately. Dashes indicate no data reported or data that do not meet publication criteria. CFOI fatal injury counts exclude illness-related deaths unless precipitated by an injury event. |
||
| Industry | Number | Percentage (%) |
|---|---|---|
|
Total |
177 | 100 |
|
Private industry (1) |
162 | 92 |
|
Natural resources and mining |
18 | 10 |
|
Agriculture, forestry, fishing and hunting |
18 | 10 |
|
Crop production |
7 | 4 |
|
Other crop farming |
4 | 2 |
|
Animal production and aquaculture |
5 | 3 |
|
Cattle ranching and farming |
5 | 3 |
|
Beef cattle ranching and farming, including feedlots |
1 | 1 |
|
Dairy cattle and milk production |
4 | 2 |
|
Forestry and logging |
6 | 3 |
|
Logging |
6 | 3 |
|
Logging |
6 | 3 |
|
Construction |
36 | 20 |
|
Construction |
36 | 20 |
|
Construction of buildings |
7 | 4 |
|
Specialty trade contractors |
24 | 14 |
|
Foundation, structure, and building exterior contractors |
11 | 6 |
|
Roofing contractors |
9 | 5 |
|
Building equipment contractors |
4 | 2 |
|
Building finishing contractors |
3 | 2 |
|
Other specialty trade contractors |
6 | 3 |
|
Manufacturing |
10 | 6 |
|
Manufacturing |
10 | 6 |
|
Food manufacturing |
3 | 2 |
|
Trade, transportation, and utilities |
41 | 23 |
|
Utilities |
6 | 3 |
|
Utilities |
6 | 3 |
|
Electric power generation, transmission and distribution |
6 | 3 |
|
Electric power generation |
6 | 3 |
|
Solar electric power generation |
6 | 3 |
|
Wholesale trade |
4 | 2 |
|
Retail trade |
11 | 6 |
|
Motor vehicle and parts dealers |
4 | 2 |
|
Building material and garden equipment and supplies dealers |
3 | 2 |
|
Transportation and warehousing |
20 | 11 |
|
Truck transportation |
11 | 6 |
|
Transit and ground passenger transportation |
5 | 3 |
|
Information |
-- | -- |
|
Financial activities |
4 | 2 |
|
Real estate and rental and leasing |
4 | 2 |
|
Real estate |
4 | 2 |
|
Professional and business services |
23 | 13 |
|
Professional, scientific, and technical services |
5 | 3 |
|
Professional, scientific, and technical services |
5 | 3 |
|
Administrative and support and waste management and remediation services |
18 | 10 |
|
Educational and health services |
-- | -- |
|
Health care and social assistance |
9 | 5 |
|
Leisure and hospitality |
-- | -- |
|
Accommodation and food services |
7 | 4 |
|
Other services (except public administration) |
9 | 5 |
|
Other services (except public administration) |
9 | 5 |
|
Personal and laundry services |
3 | 2 |
|
Government (2) |
15 | 8 |
|
Federal government |
-- | -- |
|
State government |
-- | -- |
|
Local government |
13 | 7 |
|
Footnotes: |
||
|
NOTE: Data for all years are revised and final. Totals for major categories may include subcategories not shown separately. Dashes indicate no data reported or data that do not meet publication criteria. CFOI fatal injury counts exclude illness-related deaths unless precipitated by an injury event. |
||
| Occupation (1) | Number | Percentage (%) |
|---|---|---|
|
All occupations |
177 | 100 |
|
Management occupations |
18 | 10 |
|
Business and financial operations occupations |
-- | -- |
|
Computer and mathematical occupations |
-- | -- |
|
Architecture and engineering occupations |
-- | -- |
|
Life, physical, and social science occupations |
-- | -- |
|
Community and social service occupations |
-- | -- |
|
Legal occupations |
-- | -- |
|
Educational instruction and library occupations |
-- | -- |
|
Arts, design, entertainment, sports, and media occupations |
-- | -- |
|
Healthcare practitioners and technical occupations |
4 | 2 |
|
Healthcare support occupations |
-- | -- |
|
Protective service occupations |
8 | 5 |
|
Other protective service workers |
5 | 3 |
|
Food preparation and serving related occupations |
4 | 2 |
|
Building and grounds cleaning and maintenance occupations |
16 | 9 |
|
Personal care and service occupations |
4 | 2 |
|
Sales and related occupations |
3 | 2 |
|
Office and administrative support occupations |
-- | -- |
|
Farming, fishing, and forestry occupations |
7 | 4 |
|
Construction and extraction occupations |
44 | 25 |
|
Construction trades workers |
39 | 22 |
|
Construction laborers |
18 | 10 |
|
Construction laborers |
18 | 10 |
|
Construction equipment operators |
4 | 2 |
|
Roofers |
9 | 5 |
|
Roofers |
9 | 5 |
|
Installation, maintenance, and repair occupations |
13 | 7 |
|
Supervisors of installation, maintenance, and repair workers |
3 | 2 |
|
First-line supervisors of mechanics, installers, and repairers |
3 | 2 |
|
First-line supervisors of mechanics, installers, and repairers |
3 | 2 |
|
Vehicle and mobile equipment mechanics, installers, and repairers |
6 | 3 |
|
Automotive technicians and repairers |
3 | 2 |
|
Automotive service technicians and mechanics |
3 | 2 |
|
Other installation, maintenance, and repair occupations |
4 | 2 |
|
Production occupations |
9 | 5 |
|
Other production occupations |
5 | 3 |
|
Transportation and material moving occupations |
39 | 22 |
|
Motor vehicle operators |
25 | 14 |
|
Driver/sales workers and truck drivers |
18 | 10 |
|
Heavy and tractor-trailer truck drivers |
11 | 6 |
|
Material moving workers |
7 | 4 |
|
Laborers and material movers |
5 | 3 |
|
Laborers and freight, stock, and material movers, hand |
5 | 3 |
|
Footnotes: |
||
|
NOTE: Data for all years are revised and final. Totals for major categories may include subcategories not shown separately. Dashes indicate no data reported or data that do not meet publication criteria. CFOI fatal injury counts exclude illness-related deaths unless precipitated by an injury event. |
||
| Demographic | Number | Percentage (%) |
|---|---|---|
|
Total |
177 | 100 |
|
Employee status |
||
|
Wage and salary workers (1) |
135 | 76 |
|
Self-employed (2) |
42 | 24 |
|
Sex |
||
|
Male |
158 | 89 |
|
Female |
18 | 10 |
|
Age (3) |
||
|
Under 16 years |
-- | -- |
|
16 to 17 years |
-- | -- |
|
18 to 19 years |
-- | -- |
|
20 to 24 years |
-- | -- |
|
25 to 34 years |
22 | 12 |
|
35 to 44 years |
39 | 22 |
|
45 to 54 years |
43 | 24 |
|
55 to 64 years |
36 | 20 |
|
65 years and over |
31 | 18 |
|
Race or ethnic origin (4) |
||
|
White, non-Hispanic |
115 | 65 |
|
Black or African-American, non-Hispanic |
17 | 10 |
|
Hispanic or Latino |
36 | 20 |
|
American Indian or Alaska Native, non-Hispanic |
-- | -- |
|
Asian, non-Hispanic |
5 | 3 |
|
Native Hawaiian or Pacific Islander, non-Hispanic |
-- | -- |
|
Footnotes: |
||
|
NOTE: Data for all years are revised and final. Totals for major categories may include subcategories not shown separately. Dashes indicate no data reported or data that do not meet publication criteria. CFOI fatal injury counts exclude illness-related deaths unless precipitated by an injury event. |
||
Last Modified Date: Wednesday, March 19, 2025