An official website of the United States government
 United States Department of Labor
An official website of the United States government
United States Department of Labor

The .gov means it's official.
Federal government websites often end in .gov or .mil. Before sharing sensitive information,
make sure you're on a federal government site.

The site is secure.
The
https:// ensures that you are connecting to the official website and that any
information you provide is encrypted and transmitted securely.


26-1330-ATL
Tuesday, August 04, 2026
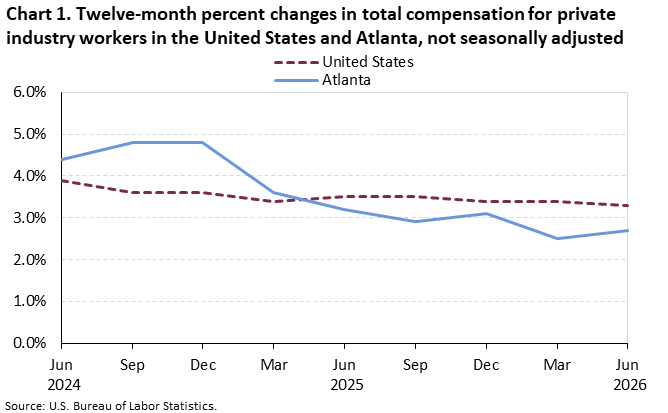
Compensation costs for private industry workers increased 2.7 percent in the Atlanta--Athens-Clarke County--Sandy Springs, GA-AL Combined Statistical Area (CSA) for the year ending in June 2026, the U.S. Bureau of Labor Statistics reported today. Regional Commissioner Victoria G. Lee noted that one year ago, Atlanta experienced an annual gain of 3.2 percent in compensation costs. (See chart 1 and table 1.) Nationwide, compensation costs rose 3.3 percent in June 2026.
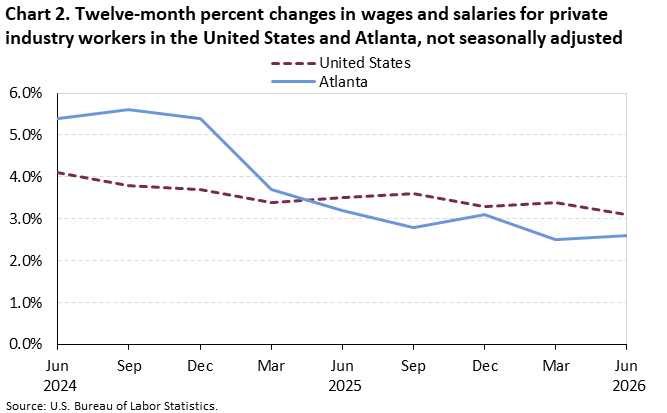
Locally, wages and salaries, the largest component of compensation costs, advanced at a 2.6-percent pace for the 12-month period ended June 2026. (See chart 2.) Nationwide, wages and salaries rose 3.1 percent over the same period.
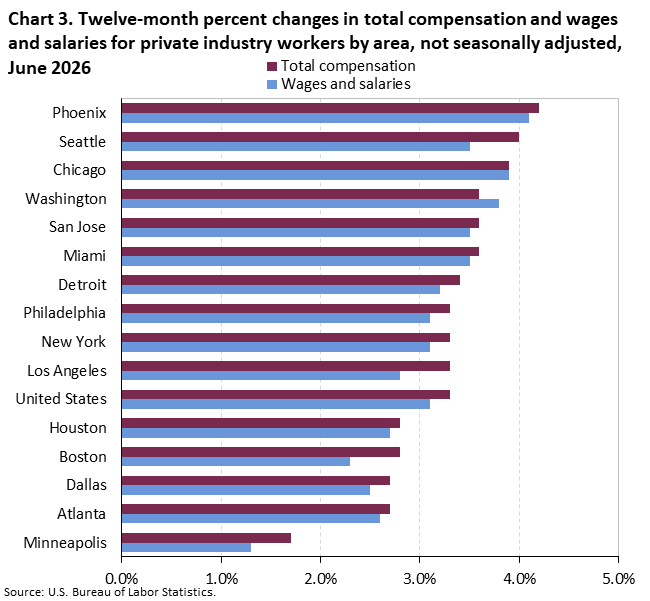
Atlanta is 1 of 15 metropolitan areas in the United States and 1 of 5 areas in the South region of the country for which locality compensation cost data are available. Among these 15 largest areas, over-the-year percentage changes in compensation costs ranged from 4.2 percent in Phoenix-Mesa to 1.7 percent in Minneapolis-St. Paul in June 2026; for wages and salaries, Phoenix registered the largest increase (4.1 percent), and Minneapolis registered the smallest (1.3 percent). (See chart 3.)
| Area | Total compensation | Wages and salaries |
|---|---|---|
| Minneapolis | 1.7 | 1.3 |
| Atlanta | 2.7 | 2.6 |
| Dallas | 2.7 | 2.5 |
| Boston | 2.8 | 2.3 |
| Houston | 2.8 | 2.7 |
| United States | 3.3 | 3.1 |
| Los Angeles | 3.3 | 2.8 |
| New York | 3.3 | 3.1 |
| Philadelphia | 3.3 | 3.1 |
| Detroit | 3.4 | 3.2 |
| Miami | 3.6 | 3.5 |
| San Jose | 3.6 | 3.5 |
| Washington | 3.6 | 3.8 |
| Chicago | 3.9 | 3.9 |
| Seattle | 4.0 | 3.5 |
| Phoenix | 4.2 | 4.1 |
The annual increase in compensation costs in Atlanta was 2.7 percent in June 2026, compared to advances that ranged from 3.6 percent to 2.7 percent in the four other metropolitan areas in the South (Dallas-Fort Worth, Houston-Pasadena, Miami-Port St. Lucie-Fort Lauderdale, and Washington-Baltimore-Arlington). Atlanta’s 2.6-percent gain in wages and salaries over this 12-month period compared to rates ranging from 3.8 percent to 2.5 percent in the four other southern localities. (See table 2.)
Beginning with the publication of Employment Cost Index (ECI) data for June 2026, relative importance estimates for select ECI series will be available in the public database with each ECI publication. Historical relative importance estimates will be available for March 2026; no further historical estimates will be provided. For more information, see Relative importance: putting the Employment Cost Index (ECI) into perspective.
Beginning with the publication of Employment Cost Index (ECI) data for December 2026, the ECI will introduce updated employment weights and remove workers’ compensation costs. For more information, see notice on weights and workers' compensation.
The Employment Cost Index for September 2026 is scheduled to be released on Friday, October 30, 2026, at 8:30 a.m. (ET).
Locality compensation costs are part of the national Employment Cost Index (ECI), which measures quarterly changes in compensation costs (wages and salaries and employer costs for employee benefits) free from the influence of employment shifts among occupations and industries. More information can be found in the national Employment Cost Index Technical Note. For information on survey concepts, coverage, methods, nonresponse adjustment, and imputation see the Employment Cost Index Handbook of Methods.
In addition to the data presented here, ECI national data by industry, occupational group, and union status, as well as data for civilian, private, and state and local government employees, are available on the Employment Cost Index website. The national Employment Cost Index Summary is also available online. Additional information for regions, states, and local areas may be accessed via our Southeast Information Office regional homepage.
The substate area data published in this news release reflect the Office of Management and Budget Bulletin No. 23-01, dated July 21, 2023. See the Tracking Wage Growth in American Cities page for more information on available geographies and their historical timelines.
The Atlanta--Athens-Clarke County--Sandy Springs, GA-AL Combined Statistical Area (CSA) includes Barrow, Bartow, Butts, Carroll, Cherokee, Clarke, Clayton, Cobb, Coweta, Dawson, DeKalb, Douglas, Fayette, Floyd, Forsyth, Fulton, Gordon, Gwinnett, Habersham, Hall, Haralson, Heard, Henry, Jackson, Jasper, Lumpkin, Madison, Meriwether, Morgan, Newton, Oconee, Oglethorpe, Paulding, Pickens, Pike, Polk, Rockdale, Spalding, Troup, Upson, and Walton Counties in Georgia and Chambers County in Alabama.
If you are deaf, hard of hearing, or have a speech disability, please dial 7-1-1 to access telecommunications relay services.
| Area | Total compensation (%) | Wages and salaries (%) | ||||||
|---|---|---|---|---|---|---|---|---|
| Mar. | Jun. | Sep. | Dec. | Mar. | Jun. | Sep. | Dec. | |
United States | ||||||||
2022 | 4.8 | 5.5 | 5.2 | 5.1 | 5.0 | 5.7 | 5.2 | 5.1 |
2023 | 4.8 | 4.5 | 4.3 | 4.1 | 5.1 | 4.6 | 4.5 | 4.3 |
2024 | 4.1 | 3.9 | 3.6 | 3.6 | 4.3 | 4.1 | 3.8 | 3.7 |
2025 | 3.4 | 3.5 | 3.5 | 3.4 | 3.4 | 3.5 | 3.6 | 3.3 |
2026 | 3.4 | 3.3 | 3.4 | 3.1 | ||||
South | ||||||||
2022 | 4.6 | 5.8 | 5.0 | 5.0 | 4.8 | 5.9 | 5.0 | 5.1 |
2023 | 5.2 | 4.4 | 4.6 | 4.4 | 5.4 | 4.6 | 4.8 | 4.6 |
2024 | 4.3 | 3.7 | 3.3 | 3.3 | 4.6 | 3.9 | 3.4 | 3.4 |
2025 | 3.3 | 3.5 | 3.6 | 3.5 | 3.3 | 3.5 | 3.8 | 3.6 |
2026 | 3.4 | 3.5 | 3.5 | 3.5 | ||||
Atlanta--Athens-Clarke County--Sandy Springs | ||||||||
2022 | 3.3 | 4.3 | 5.0 | 4.4 | 3.4 | 4.4 | 5.2 | 4.8 |
2023 | 5.1 | 4.3 | 4.0 | 3.8 | 5.6 | 4.6 | 4.6 | 4.4 |
2024 | 4.4 | 4.4 | 4.8 | 4.8 | 5.1 | 5.4 | 5.6 | 5.4 |
2025 | 3.6 | 3.2 | 2.9 | 3.1 | 3.7 | 3.2 | 2.8 | 3.1 |
2026 | 2.5 | 2.7 | 2.5 | 2.6 | ||||
| Area | Total compensation (%) | Wages and salaries (%) | ||||
|---|---|---|---|---|---|---|
| Jun. 2025 | Mar. 2026 | Jun. 2026 | Jun. 2025 | Mar. 2026 | Jun. 2026 | |
United States | 3.5 | 3.4 | 3.3 | 3.5 | 3.4 | 3.1 |
Northeast | 3.6 | 3.4 | 3.0 | 3.6 | 3.2 | 2.7 |
Boston-Worcester-Providence | 3.0 | 2.8 | 2.8 | 2.8 | 2.4 | 2.3 |
New York-Newark | 3.1 | 3.4 | 3.3 | 3.1 | 3.2 | 3.1 |
Philadelphia-Reading-Camden | 3.7 | 3.1 | 3.3 | 3.9 | 2.7 | 3.1 |
South | 3.5 | 3.4 | 3.5 | 3.5 | 3.5 | 3.5 |
Atlanta--Athens-Clarke County--Sandy Springs | 3.2 | 2.5 | 2.7 | 3.2 | 2.5 | 2.6 |
Dallas-Fort Worth | 3.7 | 2.3 | 2.7 | 3.4 | 1.8 | 2.5 |
Houston-Pasadena | 4.9 | 0.3 | 2.8 | 5.5 | 3.4 | 2.7 |
Miami-Port St. Lucie-Fort Lauderdale | 3.0 | 4.7 | 3.6 | 2.7 | 4.6 | 3.5 |
Washington-Baltimore-Arlington | 2.5 | 3.7 | 3.6 | 2.1 | 3.8 | 3.8 |
Midwest | 3.5 | 3.3 | 3.0 | 3.7 | 3.4 | 2.9 |
Chicago-Naperville | 3.6 | 4.1 | 3.9 | 3.6 | 4.1 | 3.9 |
Detroit-Warren-Ann Arbor | 2.1 | 2.3 | 3.4 | 3.5 | 3.5 | 3.2 |
Minneapolis-St. Paul | 5.3 | 1.4 | 1.7 | 5.7 | 1.0 | 1.3 |
West | 3.5 | 3.6 | 3.6 | 3.4 | 3.3 | 3.2 |
Los Angeles-Long Beach | 3.9 | 3.5 | 3.3 | 4.1 | 3.1 | 2.8 |
Phoenix-Mesa | 3.3 | 4.3 | 4.2 | 3.0 | 4.2 | 4.1 |
San Jose-San Francisco-Oakland | 3.3 | 3.8 | 3.6 | 3.1 | 4.0 | 3.5 |
Seattle-Tacoma | 4.7 | 3.3 | 4.0 | 4.6 | 2.8 | 3.5 |
Last Modified Date: Tuesday, August 04, 2026