An official website of the United States government
An official website of the United States government
The .gov means it's official.
Federal government websites often end in .gov or .mil. Before sharing sensitive information,
make sure you're on a federal government site.
The site is secure.
The
https:// ensures that you are connecting to the official website and that any
information you provide is encrypted and transmitted securely.
26-247-ATL
Wednesday, February 18, 2026
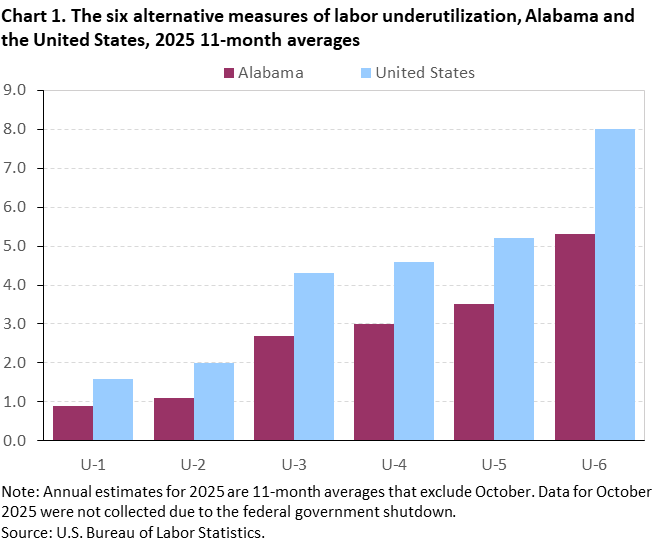
In 2025, the broadest measure of labor underutilization, designated U-6 (which includes the unemployed, workers employed part-time for economic reasons, and those marginally attached to the labor force), was 5.3 percent in Alabama, compared to the 8.0-percent rate for the nation, the U.S. Bureau of Labor Statistics reported today. Regional Commissioner Victoria G. Lee noted that the measure corresponding to the official concept of unemployment, U-3 (all jobless persons who are available to take a job and have actively sought work in the past 4 weeks), was 2.7 percent for Alabama. Nationally, the U-3 rate was 4.3 percent. (See chart 1 and table A.) The Technical Note at the end of this release provides additional information on the differences between unemployment measures and the reliability of Current Population Survey (CPS) estimates.
| Measure | Alabama | United States |
|---|---|---|
|
U-1 Persons unemployed 15 weeks or longer, as a percent of the civilian labor force |
0.9 | 1.6 |
|
U-2 Job losers and persons who completed temporary jobs, as a percent of the civilian labor force |
1.1 | 2.0 |
|
U-3 Total unemployed, as a percent of the civilian labor force (official concept of unemployment) (1) |
2.7 | 4.3 |
|
U-4 Total unemployed plus discouraged workers, as a percent of the civilian labor force plus discouraged workers (2) |
3.0 | 4.6 |
|
U-5 Total unemployed, plus discouraged workers, plus all other persons marginally attached to the labor force, as a percent of the civilian labor force plus all persons marginally attached to the labor force (2) |
3.5 | 5.2 |
|
U-6 Total unemployed, plus all persons marginally attached to the labor force, plus total employed part time for economic reasons, as a percent of the civilian labor force plus all persons marginally attached to the labor force (2) |
5.3 | 8.0 |
|
Footnotes: |
||
|
Note: Annual estimates for 2025 are 11-month averages that exclude October. Data for October 2025 were not collected due to the federal government shutdown. |
||
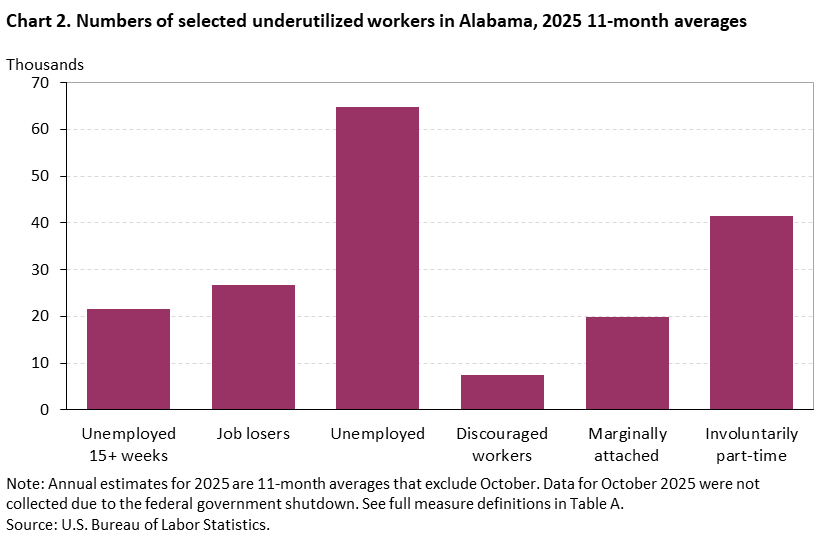
Alabama had 64,800 unemployed residents, according to the CPS. (See chart 2.) In addition, there were 41,400 workers who were employed part time for economic reasons (also known as involuntary part time). These individuals were working part time because of slack work or business conditions or because they were unable to find a full-time job.
In Alabama, 19,900 individuals were considered marginally attached to the labor force, indicating they want to work and have looked in the past year, but have not actively looked in the last four weeks for reasons such as school attendance, family responsibilities, or because they believe no jobs are available. The U-5 measure, which incorporates marginally attached workers, was 3.5 percent in Alabama. In the United States, the U-5 measure was 5.2 percent.
Within Alabama’s marginally attached population, 7,500 (38 percent) were discouraged workers who have stopped searching mainly because they believe no jobs are available to them. The U-4 measure, which includes discouraged workers and the unemployed, was 3.0 percent in Alabama; the national rate was 4.6 percent.
See table 1 for national and state estimates.
This news release presents 11-month averages from the CPS for 2025 that exclude the October reference month. Data for October 2025 were not collected due to the federal government shutdown. As a result, these estimates are not strictly comparable with annual averages for other years.
The estimates in this release are based upon the six measures of labor underutilization produced by the Current Population Survey (CPS). For the United States, BLS publishes these six measures monthly in the Employment Situation news release. The state-level alternative measures of labor underutilization are provided each quarter as 4-quarter moving averages.
Measures of unemploymentThe U-3 rates for states presented in this release are derived directly from the CPS and are not the official unemployment rates. The official unemployment rates for states are the model-based estimates available through the Local Area Unemployment Statistics (LAUS) program and may differ from the CPS estimates. The LAUS estimates are developed from statistical models that incorporate CPS estimates in addition to data from other sources. The LAUS models greatly improve the reliability of the monthly top-side labor force and unemployment estimates. CPS estimates are used in this release because this is the only source of data for the various components of the other five measures.
The other CPS measures are provided to data users and analysts who want more narrowly (U-1 and U-2) or broadly (U-4 through U-6) defined measures.
Additional information on the differences between the CPS and LAUS estimates can be found in Notes on Using Current Population Survey (CPS) Subnational Data.
Reliability of estimatesThe alternative measures for states are analyzed on a 4-quarter average basis in order to increase the reliability of the CPS estimates, which are based on relatively small sample sizes at the state level, and to eliminate seasonality. Due to the small state sample sizes, neither monthly nor quarterly statewide data from the CPS satisfy BLS publication standards.
If you are deaf, hard of hearing, or have a speech disability, please dial 7-1-1 to access telecommunications relay services.
| State | Measure | |||||
|---|---|---|---|---|---|---|
| U-1 | U-2 | U-3 | U-4 | U-5 | U-6 | |
|
United States |
1.6 | 2.0 | 4.3 | 4.6 | 5.2 | 8.0 |
|
Alabama |
0.9 | 1.1 | 2.7 | 3.0 | 3.5 | 5.3 |
|
Alaska |
1.6 | 2.5 | 5.1 | 5.5 | 6.4 | 9.0 |
|
Arizona |
1.4 | 1.9 | 4.3 | 4.6 | 5.4 | 8.5 |
|
Arkansas |
1.3 | 2.0 | 4.5 | 4.8 | 5.5 | 7.9 |
|
California |
2.4 | 2.6 | 5.3 | 5.6 | 6.3 | 10.2 |
|
Colorado |
1.5 | 1.9 | 4.0 | 4.2 | 4.8 | 8.1 |
|
Connecticut |
2.0 | 2.2 | 4.5 | 4.7 | 5.4 | 8.2 |
|
Delaware |
1.8 | 2.5 | 5.5 | 5.7 | 6.4 | 9.0 |
|
District of Columbia |
2.8 | 3.4 | 6.0 | 6.2 | 7.0 | 10.0 |
|
Florida |
1.6 | 1.5 | 3.8 | 4.3 | 5.0 | 7.9 |
|
Georgia |
1.4 | 1.4 | 3.3 | 3.5 | 4.3 | 6.5 |
|
Hawaii |
0.7 | 1.2 | 2.5 | 2.7 | 3.7 | 5.7 |
|
Idaho |
1.0 | 1.5 | 3.5 | 3.7 | 4.2 | 6.5 |
|
Illinois |
2.1 | 2.0 | 4.6 | 5.0 | 5.7 | 8.6 |
|
Indiana |
1.0 | 1.6 | 3.5 | 3.7 | 4.5 | 7.1 |
|
Iowa |
1.3 | 2.0 | 4.0 | 4.1 | 4.5 | 7.1 |
|
Kansas |
1.2 | 1.7 | 3.6 | 3.7 | 4.2 | 6.7 |
|
Kentucky |
1.5 | 1.8 | 4.6 | 4.9 | 5.7 | 8.3 |
|
Louisiana |
1.7 | 2.0 | 4.3 | 4.6 | 5.1 | 7.6 |
|
Maine |
0.9 | 1.8 | 3.2 | 3.4 | 4.4 | 7.5 |
|
Maryland |
1.5 | 1.8 | 4.4 | 4.7 | 5.6 | 8.0 |
|
Massachusetts |
1.9 | 2.5 | 4.5 | 4.8 | 5.3 | 7.6 |
|
Michigan |
1.7 | 2.4 | 5.2 | 5.5 | 6.3 | 9.2 |
|
Minnesota |
1.2 | 2.4 | 4.3 | 4.4 | 5.2 | 7.9 |
|
Mississippi |
1.6 | 2.0 | 3.9 | 4.4 | 4.9 | 7.1 |
|
Missouri |
0.9 | 1.8 | 3.8 | 4.0 | 4.5 | 6.4 |
|
Montana |
0.7 | 1.5 | 3.3 | 3.5 | 4.1 | 6.8 |
|
Nebraska |
1.0 | 1.3 | 3.2 | 3.4 | 4.0 | 6.3 |
|
Nevada |
1.9 | 2.3 | 4.8 | 5.1 | 5.6 | 9.8 |
|
New Hampshire |
1.2 | 1.9 | 3.2 | 3.4 | 4.0 | 5.9 |
|
New Jersey |
1.9 | 2.3 | 4.9 | 5.2 | 5.9 | 8.7 |
|
New Mexico |
1.6 | 1.8 | 4.2 | 4.5 | 5.3 | 8.4 |
|
New York |
2.1 | 2.0 | 4.2 | 4.6 | 5.4 | 8.0 |
|
North Carolina |
1.3 | 1.8 | 3.5 | 3.8 | 4.4 | 6.4 |
|
North Dakota |
0.6 | 1.3 | 2.8 | 2.9 | 3.3 | 5.5 |
|
Ohio |
1.6 | 2.4 | 4.8 | 5.0 | 5.7 | 8.1 |
|
Oklahoma |
1.3 | 2.0 | 3.8 | 4.0 | 4.7 | 7.2 |
|
Oregon |
2.2 | 2.9 | 5.4 | 5.7 | 6.5 | 9.6 |
|
Pennsylvania |
1.6 | 2.3 | 4.3 | 4.6 | 5.3 | 7.4 |
|
Rhode Island |
2.0 | 2.9 | 4.8 | 5.0 | 5.7 | 8.6 |
|
South Carolina |
1.3 | 1.7 | 4.2 | 4.4 | 5.2 | 7.5 |
|
South Dakota |
0.7 | 1.1 | 2.5 | 2.7 | 3.0 | 5.0 |
|
Tennessee |
1.1 | 1.4 | 3.6 | 3.9 | 4.6 | 6.8 |
|
Texas |
1.5 | 1.8 | 4.1 | 4.4 | 4.9 | 8.0 |
|
Utah |
1.1 | 1.7 | 3.7 | 3.9 | 4.3 | 7.0 |
|
Vermont |
0.7 | 1.4 | 2.8 | 2.9 | 3.5 | 5.8 |
|
Virginia |
1.8 | 1.9 | 4.3 | 4.6 | 5.3 | 8.2 |
|
Washington |
2.0 | 2.3 | 5.0 | 5.2 | 5.8 | 9.2 |
|
West Virginia |
1.7 | 1.5 | 3.9 | 4.1 | 4.7 | 7.1 |
|
Wisconsin |
1.2 | 2.1 | 3.4 | 3.5 | 4.1 | 6.5 |
|
Wyoming |
0.9 | 1.8 | 3.4 | 3.5 | 3.9 | 6.4 |
|
Note: See table A for definitions of measures. Annual estimates for 2025 are 11-month averages that exclude October. Data for October 2025 were not collected due to the federal government shutdown. |
||||||
Last Modified Date: Wednesday, February 18, 2026