An official website of the United States government
An official website of the United States government
The .gov means it's official.
Federal government websites often end in .gov or .mil. Before sharing sensitive information,
make sure you're on a federal government site.
The site is secure.
The
https:// ensures that you are connecting to the official website and that any
information you provide is encrypted and transmitted securely.
24-316-ATL
Tuesday, February 20, 2024
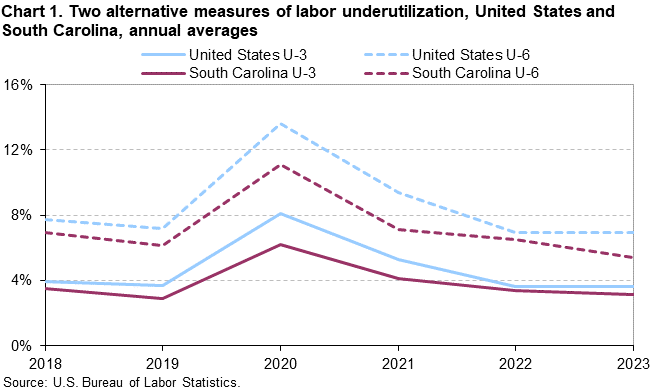
In 2023, the broadest measure of labor underutilization, designated U-6 (which includes the unemployed, workers employed part-time for economic reasons, and those marginally attached to the labor force), was 5.4 percent in South Carolina, significantly lower than the 6.9-percent rate for the nation, the U.S. Bureau of Labor Statistics reported today. Regional Commissioner Victoria G. Lee noted that 5 of the 6 alternative measures of labor underutilization in South Carolina were not significantly different from the rates recorded a year ago. Nationally, rates were unchanged over the year for all six measures. (See table 1.) The Technical Note at the end of this release provides additional information on the reliability of estimates.
The official concept of unemployment, U-3 in the U-1 to U-6 range of measures, includes all jobless persons who are available to take a job and have actively sought work in the past 4 weeks. In South Carolina, 3.1 percent of the labor force was unemployed, as measured by U-3 in 2023, compared to the national rate of 3.6 percent. (See chart 1.) The Technical Note at the end of this release provides additional information on the differences between unemployment measures.
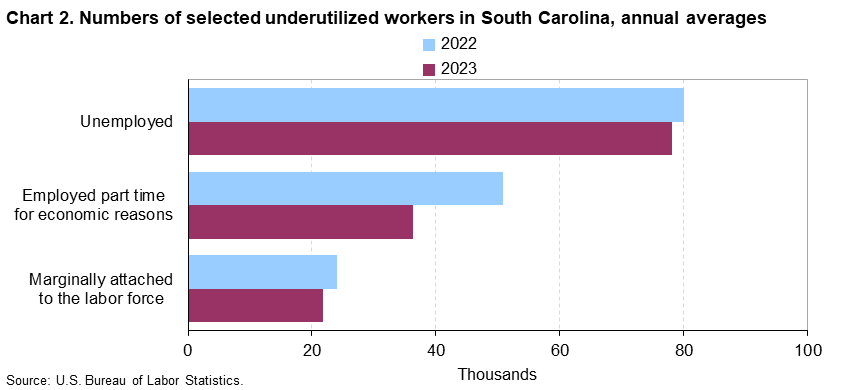
South Carolina had 78,100 unemployed residents in 2023 according to the CPS. In addition, there were 36,300 workers who were employed part time for economic reasons (also known as involuntary part time). These individuals were working part time because of slack work or business conditions or because they were unable to find a full-time job. (See chart 2.) Nationwide, there were 4.07 million individuals working part time for economic reasons in 2023.
In 2023, the number of individuals considered to be marginally attached to the labor force in South Carolina was 21,700. People marginally attached to the labor force are not working, but indicate that they would like to work, are available to work, and have looked for work at some time during the past 12 months, even though they had not searched for work in the 4 weeks preceding the survey for reasons such as school attendance or family responsibilities. In the United States, the number of people marginally attached totaled 1.46 million in 2023.
Discouraged workers, a subset of the marginally attached, are persons who are not currently looking for work because they believe no jobs are available for them. In 2023, there were 5,600 discouraged workers in South Carolina, accounting for 26 percent of the marginally attached in the state. The U-4 measure, which adds discouraged workers to the number of the unemployed (expressed as a percentage of the labor force plus the number of discouraged workers), was 3.4 percent in South Carolina, compared to the 3.9-percent rate for the nation.
State comparisonsIn 2023, 13 states had rates significantly lower than those of the U.S. for all six measures of labor underutilization, while 4 states and the District of Columbia had rates higher than those of the U.S. for all six measures. (See table 2.)
The U-4 rate includes discouraged workers; thus, the difference between U-3 and U-4 reflects the degree of would-be job-seeker discouragement. At the national level, the difference between U-3 and U-4 was +0.3 percentage point in 2023. No state had a noteworthy difference between these two measures.
The U-5 rate includes all people who are marginally attached to the labor force, and U-6 adds those who are involuntary part-time workers. Therefore, the larger the difference between U-5 and U-6, the higher the incidence of this form of "underemployment." In 2023, 47 states and the District of Columbia had significant differences between their U-5 and U-6 rates. California had the largest gap (+3.5 percentage points), followed by Oregon (+3.3 points) and Washington (+3.0 points). At the national level, the difference between U-5 and U-6 was +2.4 percentage points.
Relative to 2022, Pennsylvania was the only state to experience significant decreases in all 6 measures of labor underutilization, while Mississippi had decreases in 5 of the 6 measures. For each measure, rates declined over the year for at least three states (U-2 and U-6) and as many as seven states (U-4). Only California experienced over-the-year increases in all 6 measures, while New Jersey had increases in 5 of the 6 measures. Three additional states had increases in one measure (U-1 for Indiana and Texas and U-5 for Idaho). At the national level, rates were unchanged over the year for all six measures.
The estimates in this release are based upon the six measures of labor underutilization produced by the Current Population Survey (CPS). For the United States, BLS publishes these six measures monthly in the Employment Situation news release. The state-level alternative measures of labor underutilization are provided each quarter as 4-quarter moving averages.
Measures of unemploymentThe U-3 rates presented in this release are unofficial state estimates derived from the CPS. The official measure is a model-based estimate available through the Local Area Unemployment Statistics (LAUS) program and may differ from the CPS estimates. The LAUS estimates are developed from statistical models that incorporate CPS estimates in addition to data from other sources. The LAUS models greatly improve the reliability of the monthly top-side labor force and unemployment estimates. CPS estimates are used in this release because this is the only source of data for the various components of the other five measures. The LAUS model-based estimates are accessible through the LAUS home page.
The other CPS measures are provided to data users and analysts who want more narrowly (U-1 and U-2) or broadly (U-4 through U-6) defined measures.
Additional information on the differences between the CPS and LAUS estimates can be found in Notes on Using Current Population Survey (CPS) Subnational Data.
Reliability of estimatesThe alternative measures for states are analyzed on a 4-quarter average basis in order to increase the reliability of the CPS estimates, which are based on relatively small sample sizes at the state level, and to eliminate seasonality. Due to the small state sample sizes, neither monthly nor quarterly statewide data from the CPS satisfy BLS publication standards. The analysis in this release is written with respect to statistical significance testing at the 90-percent confidence level for rate differences with respect to the U.S., sequential gaps in rates, and over-the-year changes in rates.
Information in this release will be made available to individuals with sensory impairments upon request. Voice phone: (202) 691-5200; Telecommunications Relay Service: 7-1-1.
| Measure | United States | South Carolina | ||||
|---|---|---|---|---|---|---|
| 2022 (percent) | 2023 (percent) | Percentage change, 2022–23 | 2022 (percent) | 2023 (percent) | Percentage change, 2022–23 | |
|
U-1 Persons unemployed 15 weeks or longer, as a percent of the civilian labor force |
1.3 | 1.3 | 0.0 | 1.3 | 1.1 | -0.2 |
|
U-2 Job losers and persons who completed temporary jobs, as a percent of the civilian labor force |
1.7 | 1.7 | 0.0 | 1.3 | 1.5 | 0.2 |
|
U-3 Total unemployed, as a percent of the civilian labor force (official concept of unemployment) (1) |
3.6 | 3.6 | 0.0 | 3.4 | 3.1 | -0.3 |
|
U-4 Total unemployed plus discouraged workers, as a percent of the civilian labor force plus discouraged workers (2) |
3.9 | 3.9 | 0.0 | 3.6 | 3.4 | -0.2 |
|
U-5 Total unemployed, plus discouraged workers, plus all other persons marginally attached to the labor force, as a percent of the civilian labor force plus all persons marginally attached to the labor force (2) |
4.5 | 4.5 | 0.0 | 4.4 | 4.0 | -0.4 |
|
U-6 Total unemployed, plus all persons marginally attached to the labor force, plus total employed part time for economic reasons, as a percent of the civilian labor force plus all persons marginally attached to the labor force (2) |
6.9 | 6.9 | 0.0 | 6.5 | 5.4 | -1.1* |
|
Footnotes: |
||||||
|
Note: An asterisk indicates that the over-the-year change is statistically different at the 90-percent confidence level. |
||||||
| State | Measure | |||||
|---|---|---|---|---|---|---|
| U-1 | U-2 | U-3 | U-4 | U-5 | U-6 | |
|
United States |
1.3 | 1.7 | 3.6 | 3.9 | 4.5 | 6.9 |
|
Alabama |
0.5 | 1.2 | 2.4 | 2.6 | 2.9 | 4.0 |
|
Alaska |
1.3 | 2.7 | 4.7 | 5.1 | 6.2 | 8.8 |
|
Arizona |
1.0 | 1.6 | 3.9 | 4.1 | 4.8 | 7.3 |
|
Arkansas |
1.1 | 1.3 | 3.5 | 3.7 | 4.3 | 6.2 |
|
California |
1.9 | 2.4 | 4.7 | 5.0 | 5.8 | 9.3 |
|
Colorado |
0.8 | 1.2 | 3.2 | 3.3 | 3.8 | 6.5 |
|
Connecticut |
1.4 | 2.1 | 3.7 | 3.9 | 4.3 | 7.1 |
|
Delaware |
1.3 | 1.8 | 3.6 | 3.6 | 4.1 | 7.0 |
|
District of Columbia |
2.5 | 2.4 | 4.8 | 5.1 | 5.8 | 7.9 |
|
Florida |
0.9 | 1.2 | 2.7 | 3.0 | 3.6 | 5.9 |
|
Georgia |
0.9 | 1.6 | 3.4 | 3.7 | 4.3 | 6.2 |
|
Hawaii |
1.2 | 1.3 | 3.0 | 3.1 | 3.8 | 6.1 |
|
Idaho |
0.8 | 1.7 | 3.3 | 3.5 | 4.0 | 6.5 |
|
Illinois |
1.8 | 2.3 | 4.4 | 4.6 | 5.3 | 7.7 |
|
Indiana |
1.1 | 1.5 | 3.5 | 3.7 | 4.3 | 6.3 |
|
Iowa |
0.8 | 1.6 | 2.9 | 3.1 | 3.6 | 5.5 |
|
Kansas |
0.9 | 1.3 | 2.8 | 2.9 | 3.3 | 5.2 |
|
Kentucky |
1.2 | 1.6 | 4.3 | 4.4 | 4.9 | 7.2 |
|
Louisiana |
1.4 | 1.9 | 3.7 | 4.0 | 4.6 | 6.8 |
|
Maine |
0.9 | 1.4 | 3.1 | 3.3 | 3.9 | 6.0 |
|
Maryland |
0.9 | 1.1 | 2.7 | 2.9 | 3.6 | 5.6 |
|
Massachusetts |
1.2 | 1.8 | 3.4 | 3.6 | 4.1 | 6.0 |
|
Michigan |
1.4 | 1.6 | 3.9 | 4.0 | 4.8 | 7.1 |
|
Minnesota |
0.7 | 1.4 | 2.9 | 3.0 | 3.7 | 5.3 |
|
Mississippi |
1.1 | 0.9 | 3.1 | 3.2 | 3.6 | 5.3 |
|
Missouri |
0.8 | 1.4 | 3.0 | 3.2 | 3.7 | 5.5 |
|
Montana |
0.7 | 1.4 | 2.9 | 3.1 | 3.7 | 6.1 |
|
Nebraska |
0.4 | 1.0 | 2.2 | 2.3 | 2.8 | 4.5 |
|
Nevada |
1.4 | 2.3 | 5.0 | 5.1 | 6.1 | 9.0 |
|
New Hampshire |
0.7 | 1.0 | 2.4 | 2.5 | 3.0 | 4.5 |
|
New Jersey |
2.2 | 2.8 | 4.7 | 4.9 | 5.6 | 8.3 |
|
New Mexico |
1.3 | 1.8 | 3.9 | 4.1 | 4.6 | 7.2 |
|
New York |
1.9 | 2.3 | 4.3 | 4.7 | 5.6 | 8.1 |
|
North Carolina |
1.0 | 1.4 | 3.2 | 3.4 | 3.9 | 6.2 |
|
North Dakota |
0.5 | 0.8 | 2.0 | 2.2 | 2.7 | 4.0 |
|
Ohio |
1.0 | 1.4 | 3.4 | 3.5 | 4.1 | 6.0 |
|
Oklahoma |
0.9 | 1.4 | 3.5 | 3.6 | 4.2 | 6.6 |
|
Oregon |
1.0 | 1.7 | 3.7 | 3.9 | 4.7 | 8.0 |
|
Pennsylvania |
1.0 | 1.3 | 3.1 | 3.3 | 4.0 | 6.2 |
|
Rhode Island |
1.6 | 1.7 | 3.3 | 3.5 | 4.1 | 6.6 |
|
South Carolina |
1.1 | 1.5 | 3.1 | 3.4 | 4.0 | 5.4 |
|
South Dakota |
0.3 | 0.8 | 1.9 | 1.9 | 2.3 | 3.9 |
|
Tennessee |
1.1 | 1.5 | 3.4 | 3.6 | 4.2 | 6.0 |
|
Texas |
1.4 | 1.8 | 4.0 | 4.2 | 4.7 | 7.4 |
|
Utah |
0.5 | 1.3 | 2.7 | 2.8 | 3.3 | 5.4 |
|
Vermont |
0.5 | 0.8 | 1.8 | 2.0 | 2.6 | 3.9 |
|
Virginia |
0.8 | 1.2 | 2.8 | 2.9 | 3.3 | 5.3 |
|
Washington |
1.1 | 2.0 | 4.1 | 4.4 | 5.1 | 8.1 |
|
West Virginia |
1.2 | 1.5 | 3.7 | 4.0 | 4.5 | 6.3 |
|
Wisconsin |
0.9 | 1.7 | 3.2 | 3.3 | 3.6 | 5.6 |
|
Wyoming |
0.8 | 1.3 | 3.0 | 3.0 | 3.5 | 5.6 |
|
Note: See table 1 for definitions of measures. Statistical significance results at the 90-percent confidence level for rate differences between states and the U.S., for sequential gaps in state rates, and over-the-year changes are available at www.bls.gov/lau/stalt.htm. |
||||||
Last Modified Date: Tuesday, February 20, 2024