An official website of the United States government
An official website of the United States government
The .gov means it's official.
Federal government websites often end in .gov or .mil. Before sharing sensitive information,
make sure you're on a federal government site.
The site is secure.
The
https:// ensures that you are connecting to the official website and that any
information you provide is encrypted and transmitted securely.
21-396-DAL
Wednesday, April 07, 2021
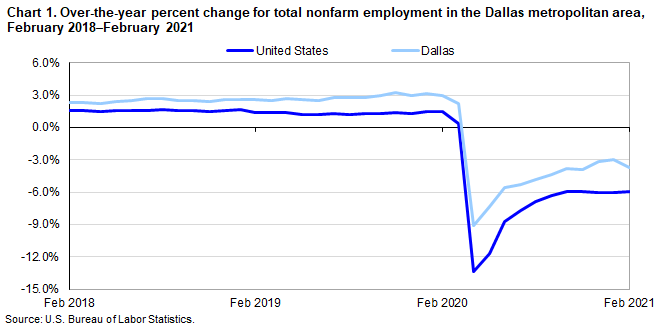
Total nonfarm employment in the Dallas-Fort Worth-Arlington, TX Metropolitan Statistical Area decreased by 142,900 over the year in February, the U.S. Bureau of Labor Statistics reported today. (See table 1.) Regional Commissioner Michael Hirniak noted that the local rate of job loss, 3.7 percent, compared to the 5.9-percent national decline. (See chart 1.) This was the 11th consecutive month of over-the-year declines locally. (The Technical Note at the end of this release contains metropolitan area definitions. All data in this release are not seasonally adjusted; accordingly, over-the-year analysis is used throughout.)
The Dallas-Fort Worth-Arlington Metropolitan Statistical Area consists of two metropolitan divisions – separately identifiable employment centers within the larger metropolitan area. Both divisions posted employment declines over the year. The Dallas-Plano-Irving Metropolitan Division, with 71 percent of the area’s total nonfarm employment, lost 93,700 jobs since February 2020, a decrease of 3.4 percent. The Fort Worth-Arlington Metropolitan Division, which accounted for the remaining 29 percent of the area’s workforce, lost 49,200 jobs during the period, a decline of 4.5 percent.
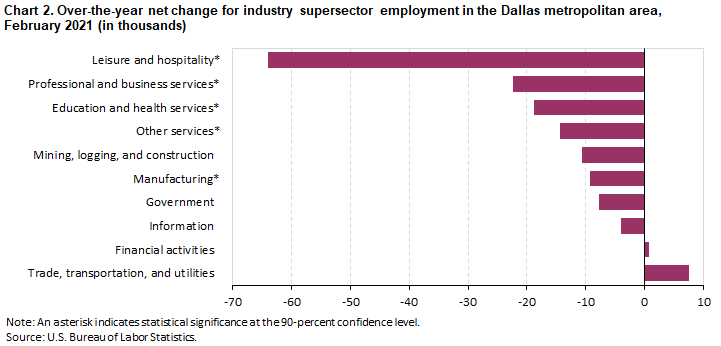
Industry employmentIn the greater Dallas metropolitan area, leisure and hospitality had the largest loss, down 63,900, with the accommodation and food services sector accounting for 52,600 lost jobs. (See chart 2.) The 16.1-percent rate of job decline in the local leisure and hospitality supersector compared to the 20.0-percent national loss.
Dallas-Fort Worth-Arlington’s professional and business services supersector lost 22,400 jobs from February 2020 to February 2021. A loss of 16,300 jobs in the administrative and support and waste management and remediation services sector in Dallas-Plano-Irving accounted for the majority of the decline. The professional and business services supersector had a 3.4-percent rate of job decline in Dallas, which compared to the national decrease of 3.3 percent.
Employment in education and health services fell by 18,800 in the local area from February a year ago. The Dallas-Plano-Irving metropolitan division lost 12,500 jobs and the Fort Worth-Arlington division lost 6,300 jobs. Dallas-Fort Worth-Arlington’s 4.0-percent annual decrease in education and health services jobs compared to the U.S. loss of 5.2 percent.
Other services employment lost 14,400 jobs over the year in Dallas-Fort Worth-Arlington. The Dallas-Plano-Irving division was responsible for most of that loss (-10,900). The local 11.2-percent rate of loss in other services jobs compared to the national decrease of 7.3 percent.
Manufacturing employment fell by 9,300 over the year in the local area. The Dallas-Fort Worth-Arlington area had a 3.2-percent rate of decrease in manufacturing jobs compared to the national decrease of 4.2 percent.
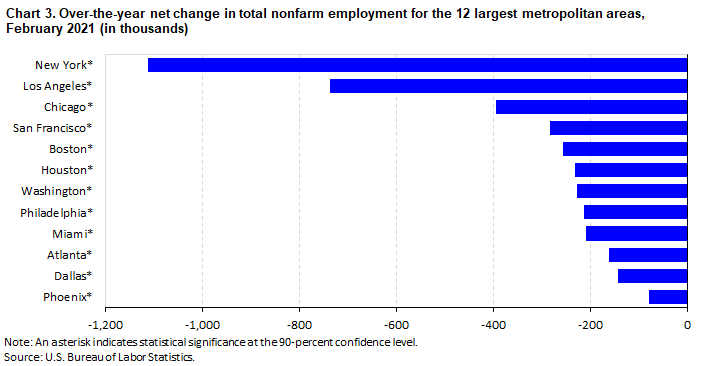
Employment in the 12 largest metropolitan areasDallas was 1 of the nation’s 12 largest metropolitan statistical areas in February 2021. All 12 areas lost jobs over the year. New York-Newark-Jersey City had the largest decline (-1,113,600). Phoenix-Mesa-Scottsdale had the smallest loss (-79,600) among the largest areas. (See chart 3 and table 2.)
Los Angeles-Long Beach-Anaheim had an 11.7-percent rate of job loss, followed by San Francisco-Oakland-Hayward (-11.3 percent) and New York (-11.2 percent). The rates of job losses in the remaining nine areas ranged from 9.1 percent in Boston-Cambridge-Nashua to 3.6 percent in Phoenix.
Metropolitan area employment and unemployment data for March 2021 are scheduled to be released on Wednesday, April 28, 2021, at 10:00 a.m. (ET).
BLS has continued to review all estimation and methodological procedures for the establishment survey, which included the review of data, estimation processes, the application of the birth-death model, and seasonal adjustment. Business births and deaths cannot be adequately captured by the establishment survey as they occur. Therefore, the Current Employment Statistics (CES) program uses a model to account for the relatively stable net employment change generated by business births and deaths. Due to the impact of COVID-19, the relationship between business births and deaths is no longer stable. Typically, reports with zero employment are not included in estimation. For the January final and February preliminary estimates, CES included a portion of these reports in the estimates and made modifications to the birth-death model. In addition for both months, the establishment survey included a portion of the reports that returned to reporting positive employment from reporting zero employment. For more information, see www.bls.gov/web/empsit/cesbd.htm.
In the establishment survey, workers who are paid by their employer for all or any part of the pay period including the 12th of the month are counted as employed, even if they were not actually at their jobs. Workers who are temporarily or permanently absent from their jobs and are not being paid are not counted as employed, even if they are continuing to receive benefits. The length of the reference period does vary across the respondents in the establishment survey; one-third of businesses have a weekly pay period, slightly over 40 percent a bi-weekly, about 20 percent semi-monthly, and a small amount monthly.
This release presents nonfarm payroll employment estimates from the Current Employment Statistics (CES) program. The CES survey is a Federal-State cooperative endeavor between State employment security agencies and the Bureau of Labor Statistics.
Definitions. Employment data refer to persons on establishment payrolls who receive pay for any part of the pay period which includes the 12th of the month. Persons are counted at their place of work rather than at their place of residence; those appearing on more than one payroll are counted on each payroll. Industries are classified on the basis of their principal activity in accordance with the 2017 version of the North American Industry Classification System.
Method of estimation. CES State and Area employment data are produced using several estimation procedures. Where possible these data are produced using a "weighted link relative" estimation technique in which a ratio of current-month weighted employment to that of the previous-month weighted employment is computed from a sample of establishments reporting for both months. The estimates of employment for the current month are then obtained by multiplying these ratios by the previous month's employment estimates. The weighted link relative technique is utilized for data series where the sample size meets certain statistical criteria.
For some employment series, the sample of establishments is very small or highly variable. In these cases, a model-based approach is used in estimation. These models use the direct sample estimates (described above), combined with forecasts of historical (benchmarked) data to decrease volatility in estimation. Two different models (Fay-Herriot Model and Small Domain Model) are used depending on the industry level being estimated. For more detailed information about each model, refer to the BLS Handbook of Methods at www.bls.gov/opub/hom/pdf/ces-20110307.pdf.
Annual revisions. Employment estimates are adjusted annually to a complete count of jobs, called benchmarks, derived principally from tax reports which are submitted by employers who are covered under state unemployment insurance (UI) laws. The benchmark information is used to adjust the monthly estimates between the new benchmark and the preceding one and also to establish the level of employment for the new benchmark month. Thus, the benchmarking process establishes the level of employment, and the sample is used to measure the month-to-month changes in the level for the subsequent months.
Reliability of the estimates. The estimates presented in this release are based on sample surveys, administrative data, and modeling and, thus, are subject to sampling and other types of errors. Sampling error is a measure of sampling variability—that is, variation that occurs by chance because a sample rather than the entire population is surveyed. Survey data also are subject to nonsampling errors, such as those which can be introduced into the data collection and processing operations. Estimates not directly derived from sample surveys are subject to additional errors resulting from the specific estimation processes used. The sums of individual items may not always equal the totals shown in the same tables because of rounding.
Employment estimates. Changes in metropolitan area nonfarm payroll employment are cited in the analysis of this release only if they have been determined to be statistically significant at the 90-percent confidence level. Measures of sampling error for the total nonfarm employment series are available for metropolitan areas and metropolitan divisions at www.bls.gov/web/laus/790stderr.htm. Measures of sampling error for more detailed series at the area and division level are available upon request. Measures of sampling error for states at the supersector level and for the private service-providing, goods-producing, total private and total nonfarm levels are available on the BLS website at https://www.bls.gov/web/laus/790stderr.htm. Information on recent benchmark revisions is available online at www.bls.gov/web/laus/benchmark.htm.
Area definitions. The substate area data published in this release reflect the delineations issued by the U.S. Office of Management and Budget, dated April 10, 2018.
The Dallas-Fort Worth-Arlington Metropolitan Statistical Area includes Collin, Dallas, Denton, Ellis, Hood, Hunt, Johnson, Kaufman, Parker, Rockwall, Somervell, Tarrant, and Wise Counties in Texas.
The Dallas-Plano-Irving Metropolitan Division includes Collin, Dallas, Denton, Ellis, Hunt, Kaufman, and Rockwall Counties in Texas.
The Fort Worth-Arlington Metropolitan Division includes Hood, Johnson, Parker, Somervell, Tarrant, and Wise Counties in Texas.
Additional information
Employment data from the CES program are available on the BLS website at www.bls.gov/sae/.
Information in this release will be made available to individuals with sensory impairments upon request. Voice phone: (202) 691-5200; Federal Relay Service: (800) 877-8339.
| Area and Industry | Feb. 2020 |
Dec. 2020 |
Jan. 2021 |
Feb. 2021(p) |
Feb. 2020 to Feb. 2021(p) |
|
|---|---|---|---|---|---|---|
| Net change | Percent change | |||||
|
United States |
||||||
|
Total nonfarm |
150,968 | 143,602 | 140,980 | 142,077 | -8,891 | -5.9 |
|
Mining and logging |
675 | 602 | 593 | 584 | -91 | -13.5 |
|
Construction |
7,278 | 7,312 | 7,067 | 7,006 | -272 | -3.7 |
|
Manufacturing |
12,727 | 12,251 | 12,142 | 12,188 | -539 | -4.2 |
|
Trade, transportation, and utilities |
27,504 | 27,799 | 26,957 | 26,805 | -699 | -2.5 |
|
Information |
2,894 | 2,668 | 2,648 | 2,670 | -224 | -7.7 |
|
Financial activities |
8,820 | 8,788 | 8,733 | 8,734 | -86 | -1.0 |
|
Professional and business services |
21,134 | 20,638 | 20,291 | 20,442 | -692 | -3.3 |
|
Education and health services |
24,668 | 23,400 | 23,105 | 23,393 | -1,275 | -5.2 |
|
Leisure and hospitality |
16,292 | 12,896 | 12,576 | 13,037 | -3,255 | -20.0 |
|
Other services |
5,882 | 5,448 | 5,415 | 5,453 | -429 | -7.3 |
|
Government |
23,094 | 21,800 | 21,453 | 21,765 | -1,329 | -5.8 |
|
Dallas-Fort Worth-Arlington, TX Metropolitan Statistical Area |
||||||
|
Total nonfarm |
3,838.8 | 3,755.0 | 3,701.8 | 3,695.9 | -142.9 | -3.7 |
|
Mining, logging, and construction |
225.6 | 219.3 | 216.4 | 214.9 | -10.7 | -4.7 |
|
Manufacturing |
291.0 | 281.0 | 280.8 | 281.7 | -9.3 | -3.2 |
|
Trade, transportation, and utilities |
801.1 | 837.1 | 810.5 | 808.6 | 7.5 | 0.9 |
|
Information |
83.1 | 78.9 | 79.1 | 79.1 | -4.0 | -4.8 |
|
Financial activities |
325.8 | 328.4 | 326.4 | 326.6 | 0.8 | 0.2 |
|
Professional and business services |
655.4 | 646.0 | 645.2 | 633.0 | -22.4 | -3.4 |
|
Education and health services |
470.6 | 454.1 | 449.6 | 451.8 | -18.8 | -4.0 |
|
Leisure and hospitality |
396.1 | 338.4 | 330.8 | 332.2 | -63.9 | -16.1 |
|
Other services |
128.6 | 114.6 | 114.0 | 114.2 | -14.4 | -11.2 |
|
Government |
461.5 | 457.2 | 449.0 | 453.8 | -7.7 | -1.7 |
|
Dallas-Plano-Irving, TX Metropolitan Division |
||||||
|
Total nonfarm |
2,735.4 | 2,677.1 | 2,640.9 | 2,641.7 | -93.7 | -3.4 |
|
Mining, logging, and construction |
149.8 | 146.0 | 143.4 | 143.9 | -5.9 | -3.9 |
|
Manufacturing |
187.1 | 181.6 | 182.1 | 181.9 | -5.2 | -2.8 |
|
Trade, transportation, and utilities |
532.9 | 558.4 | 540.8 | 541.5 | 8.6 | 1.6 |
|
Information |
72.4 | 69.4 | 69.6 | 69.6 | -2.8 | -3.9 |
|
Financial activities |
257.2 | 260.2 | 258.8 | 259.5 | 2.3 | 0.9 |
|
Professional and business services |
531.7 | 521.9 | 522.2 | 513.4 | -18.3 | -3.4 |
|
Education and health services |
326.6 | 315.5 | 313.0 | 314.1 | -12.5 | -3.8 |
|
Leisure and hospitality |
270.9 | 229.3 | 224.3 | 226.9 | -44.0 | -16.2 |
|
Other services |
86.4 | 75.9 | 75.5 | 75.5 | -10.9 | -12.6 |
|
Government |
320.4 | 318.9 | 311.2 | 315.4 | -5.0 | -1.6 |
|
Fort Worth-Arlington, TX Metropolitan Division |
||||||
|
Total nonfarm |
1,103.4 | 1,077.9 | 1,060.9 | 1,054.2 | -49.2 | -4.5 |
|
Mining, logging, and construction |
75.8 | 73.3 | 73.0 | 71.0 | -4.8 | -6.3 |
|
Manufacturing |
103.9 | 99.4 | 98.7 | 99.8 | -4.1 | -3.9 |
|
Trade, transportation, and utilities |
268.2 | 278.7 | 269.7 | 267.1 | -1.1 | -0.4 |
|
Information |
10.7 | 9.5 | 9.5 | 9.5 | -1.2 | -11.2 |
|
Financial activities |
68.6 | 68.2 | 67.6 | 67.1 | -1.5 | -2.2 |
|
Professional and business services |
123.7 | 124.1 | 123.0 | 119.6 | -4.1 | -3.3 |
|
Education and health services |
144.0 | 138.6 | 136.6 | 137.7 | -6.3 | -4.4 |
|
Leisure and hospitality |
125.2 | 109.1 | 106.5 | 105.3 | -19.9 | -15.9 |
|
Other services |
42.2 | 38.7 | 38.5 | 38.7 | -3.5 | -8.3 |
|
Government |
141.1 | 138.3 | 137.8 | 138.4 | -2.7 | -1.9 |
|
(p) preliminary |
||||||
| Area and Industry | Feb. 2020 |
Dec. 2020 |
Jan. 2021 |
Feb. 2021(p) |
Feb. 2020 to Feb. 2021(p) |
|
|---|---|---|---|---|---|---|
| Net change | Percent change | |||||
|
Atlanta-Sandy Springs-Roswell, GA |
||||||
|
Total nonfarm |
2,867.9 | 2,741.6 | 2,697.6 | 2,706.3 | -161.6 | -5.6 |
|
Mining and logging |
1.7 | 1.7 | 1.7 | 1.7 | 0.0 | 0.0 |
|
Construction |
130.9 | 128.1 | 126.3 | 128.4 | -2.5 | -1.9 |
|
Manufacturing |
171.4 | 165.4 | 162.9 | 163.9 | -7.5 | -4.4 |
|
Trade, transportation, and utilities |
601.2 | 606.5 | 588.4 | 589.7 | -11.5 | -1.9 |
|
Information |
106.0 | 97.9 | 97.9 | 97.7 | -8.3 | -7.8 |
|
Financial activities |
180.8 | 181.8 | 178.8 | 178.3 | -2.5 | -1.4 |
|
Professional and business services |
552.7 | 535.6 | 530.3 | 529.1 | -23.6 | -4.3 |
|
Education and health services |
376.6 | 359.3 | 354.2 | 358.6 | -18.0 | -4.8 |
|
Leisure and hospitality |
300.7 | 243.7 | 236.7 | 240.1 | -60.6 | -20.2 |
|
Other services |
106.4 | 91.9 | 91.8 | 91.1 | -15.3 | -14.4 |
|
Government |
339.5 | 329.7 | 328.6 | 327.7 | -11.8 | -3.5 |
|
Boston-Cambridge-Nashua, MA-NH |
||||||
|
Total nonfarm |
2,809.5 | 2,572.2 | 2,532.1 | 2,552.8 | -256.7 | -9.1 |
|
Mining, logging, and construction |
116.1 | 120.0 | 114.1 | 111.6 | -4.5 | -3.9 |
|
Manufacturing |
186.2 | 177.1 | 175.2 | 176.5 | -9.7 | -5.2 |
|
Trade, transportation, and utilities |
421.2 | 408.6 | 399.7 | 395.4 | -25.8 | -6.1 |
|
Information |
83.7 | 76.8 | 79.0 | 78.3 | -5.4 | -6.5 |
|
Financial activities |
184.6 | 179.9 | 181.1 | 181.5 | -3.1 | -1.7 |
|
Professional and business services |
514.8 | 502.5 | 496.0 | 502.0 | -12.8 | -2.5 |
|
Education and health services |
610.1 | 548.0 | 543.7 | 553.7 | -56.4 | -9.2 |
|
Leisure and hospitality |
267.9 | 175.3 | 165.4 | 173.0 | -94.9 | -35.4 |
|
Other services |
103.4 | 84.2 | 83.9 | 83.3 | -20.1 | -19.4 |
|
Government |
321.5 | 299.8 | 294.0 | 297.5 | -24.0 | -7.5 |
|
Chicago-Naperville-Elgin, IL-IN-WI |
||||||
|
Total nonfarm |
4,699.1 | 4,384.6 | 4,287.4 | 4,304.8 | -394.3 | -8.4 |
|
Mining and logging |
1.7 | 1.5 | 1.4 | 1.4 | -0.3 | -17.6 |
|
Construction |
160.2 | 164.0 | 148.5 | 143.5 | -16.7 | -10.4 |
|
Manufacturing |
416.0 | 394.8 | 389.6 | 392.3 | -23.7 | -5.7 |
|
Trade, transportation, and utilities |
936.2 | 945.2 | 917.3 | 909.6 | -26.6 | -2.8 |
|
Information |
78.4 | 71.7 | 71.0 | 71.7 | -6.7 | -8.5 |
|
Financial activities |
317.7 | 316.8 | 313.7 | 313.0 | -4.7 | -1.5 |
|
Professional and business services |
818.6 | 789.4 | 772.5 | 768.8 | -49.8 | -6.1 |
|
Education and health services |
746.5 | 699.9 | 692.2 | 698.7 | -47.8 | -6.4 |
|
Leisure and hospitality |
475.1 | 308.8 | 297.0 | 314.7 | -160.4 | -33.8 |
|
Other services |
196.0 | 174.8 | 175.2 | 174.2 | -21.8 | -11.1 |
|
Government |
552.7 | 517.7 | 509.0 | 516.9 | -35.8 | -6.5 |
|
Dallas-Fort Worth-Arlington, TX |
||||||
|
Total nonfarm |
3,838.8 | 3,755.0 | 3,701.8 | 3,695.9 | -142.9 | -3.7 |
|
Mining, logging, and construction |
225.6 | 219.3 | 216.4 | 214.9 | -10.7 | -4.7 |
|
Manufacturing |
291.0 | 281.0 | 280.8 | 281.7 | -9.3 | -3.2 |
|
Trade, transportation, and utilities |
801.1 | 837.1 | 810.5 | 808.6 | 7.5 | 0.9 |
|
Information |
83.1 | 78.9 | 79.1 | 79.1 | -4.0 | -4.8 |
|
Financial activities |
325.8 | 328.4 | 326.4 | 326.6 | 0.8 | 0.2 |
|
Professional and business services |
655.4 | 646.0 | 645.2 | 633.0 | -22.4 | -3.4 |
|
Education and health services |
470.6 | 454.1 | 449.6 | 451.8 | -18.8 | -4.0 |
|
Leisure and hospitality |
396.1 | 338.4 | 330.8 | 332.2 | -63.9 | -16.1 |
|
Other services |
128.6 | 114.6 | 114.0 | 114.2 | -14.4 | -11.2 |
|
Government |
461.5 | 457.2 | 449.0 | 453.8 | -7.7 | -1.7 |
|
Houston-The Woodlands-Sugar Land, TX |
||||||
|
Total nonfarm |
3,192.2 | 2,995.7 | 2,952.3 | 2,959.2 | -233.0 | -7.3 |
|
Mining and logging |
78.4 | 66.3 | 67.0 | 67.6 | -10.8 | -13.8 |
|
Construction |
237.4 | 200.9 | 198.3 | 199.8 | -37.6 | -15.8 |
|
Manufacturing |
234.5 | 208.7 | 205.6 | 205.2 | -29.3 | -12.5 |
|
Trade, transportation, and utilities |
628.9 | 633.6 | 620.0 | 618.6 | -10.3 | -1.6 |
|
Information |
32.7 | 29.0 | 28.7 | 28.7 | -4.0 | -12.2 |
|
Financial activities |
169.2 | 163.3 | 162.8 | 162.0 | -7.2 | -4.3 |
|
Professional and business services |
514.7 | 483.8 | 479.7 | 478.6 | -36.1 | -7.0 |
|
Education and health services |
414.4 | 398.0 | 393.6 | 392.1 | -22.3 | -5.4 |
|
Leisure and hospitality |
334.5 | 287.2 | 282.9 | 283.5 | -51.0 | -15.2 |
|
Other services |
119.1 | 104.8 | 104.9 | 104.4 | -14.7 | -12.3 |
|
Government |
428.4 | 420.1 | 408.8 | 418.7 | -9.7 | -2.3 |
|
Los Angeles-Long Beach-Anaheim, CA |
||||||
|
Total nonfarm |
6,303.0 | 5,627.3 | 5,492.7 | 5,564.6 | -738.4 | -11.7 |
|
Mining and logging |
2.3 | 1.9 | 1.9 | 1.9 | -0.4 | -17.4 |
|
Construction |
260.0 | 247.4 | 247.8 | 246.8 | -13.2 | -5.1 |
|
Manufacturing |
496.3 | 454.7 | 445.0 | 449.0 | -47.3 | -9.5 |
|
Trade, transportation, and utilities |
1,101.3 | 1,076.8 | 1,045.5 | 1,041.6 | -59.7 | -5.4 |
|
Information |
265.0 | 202.4 | 197.1 | 199.4 | -65.6 | -24.8 |
|
Financial activities |
342.7 | 325.4 | 323.3 | 322.4 | -20.3 | -5.9 |
|
Professional and business services |
975.5 | 901.6 | 883.8 | 892.5 | -83.0 | -8.5 |
|
Education and health services |
1,103.5 | 1,053.0 | 1,039.7 | 1,047.8 | -55.7 | -5.0 |
|
Leisure and hospitality |
773.4 | 501.0 | 458.4 | 505.9 | -267.5 | -34.6 |
|
Other services |
217.0 | 157.5 | 153.1 | 158.5 | -58.5 | -27.0 |
|
Government |
766.0 | 705.6 | 697.1 | 698.8 | -67.2 | -8.8 |
|
Miami-Fort Lauderdale-West Palm Beach, FL |
||||||
|
Total nonfarm |
2,765.4 | 2,570.9 | 2,542.4 | 2,555.8 | -209.6 | -7.6 |
|
Mining and logging |
0.8 | 0.8 | 0.8 | 0.8 | 0.0 | 0.0 |
|
Construction |
142.6 | 137.9 | 137.4 | 138.0 | -4.6 | -3.2 |
|
Manufacturing |
91.8 | 89.3 | 86.2 | 87.3 | -4.5 | -4.9 |
|
Trade, transportation, and utilities |
617.6 | 593.1 | 580.0 | 577.0 | -40.6 | -6.6 |
|
Information |
51.8 | 46.3 | 46.0 | 46.5 | -5.3 | -10.2 |
|
Financial activities |
191.9 | 191.3 | 187.2 | 187.4 | -4.5 | -2.3 |
|
Professional and business services |
457.1 | 443.9 | 438.5 | 443.0 | -14.1 | -3.1 |
|
Education and health services |
422.0 | 396.7 | 395.2 | 397.3 | -24.7 | -5.9 |
|
Leisure and hospitality |
344.9 | 261.6 | 263.4 | 268.2 | -76.7 | -22.2 |
|
Other services |
121.0 | 105.8 | 106.0 | 107.0 | -14.0 | -11.6 |
|
Government |
323.9 | 304.2 | 301.7 | 303.3 | -20.6 | -6.4 |
|
New York-Newark-Jersey City, NY-NJ-PA |
||||||
|
Total nonfarm |
9,933.2 | 9,001.7 | 8,767.6 | 8,819.6 | -1,113.6 | -11.2 |
|
Mining, logging, and construction |
401.3 | 381.0 | 359.7 | 346.7 | -54.6 | -13.6 |
|
Manufacturing |
355.0 | 330.3 | 325.9 | 327.5 | -27.5 | -7.7 |
|
Trade, transportation, and utilities |
1,709.6 | 1,612.3 | 1,553.1 | 1,535.4 | -174.2 | -10.2 |
|
Information |
314.2 | 285.7 | 281.7 | 286.5 | -27.7 | -8.8 |
|
Financial activities |
789.7 | 761.0 | 756.7 | 755.3 | -34.4 | -4.4 |
|
Professional and business services |
1,570.8 | 1,469.9 | 1,434.8 | 1,449.1 | -121.7 | -7.7 |
|
Education and health services |
2,119.6 | 1,956.5 | 1,917.6 | 1,947.2 | -172.4 | -8.1 |
|
Leisure and hospitality |
905.0 | 559.2 | 525.4 | 544.4 | -360.6 | -39.8 |
|
Other services |
425.3 | 344.2 | 341.0 | 341.6 | -83.7 | -19.7 |
|
Government |
1,342.7 | 1,301.6 | 1,271.7 | 1,285.9 | -56.8 | -4.2 |
|
Philadelphia-Camden-Wilmington, PA-NJ-DE-MD |
||||||
|
Total nonfarm |
2,976.4 | 2,783.7 | 2,732.2 | 2,761.8 | -214.6 | -7.2 |
|
Mining, logging, and construction |
115.7 | 114.8 | 110.3 | 111.6 | -4.1 | -3.5 |
|
Manufacturing |
182.8 | 175.1 | 172.1 | 172.2 | -10.6 | -5.8 |
|
Trade, transportation, and utilities |
523.5 | 527.2 | 506.3 | 504.3 | -19.2 | -3.7 |
|
Information |
53.8 | 50.1 | 49.1 | 49.6 | -4.2 | -7.8 |
|
Financial activities |
218.2 | 215.6 | 214.4 | 215.9 | -2.3 | -1.1 |
|
Professional and business services |
464.4 | 451.4 | 449.0 | 454.1 | -10.3 | -2.2 |
|
Education and health services |
684.7 | 636.9 | 626.5 | 639.5 | -45.2 | -6.6 |
|
Leisure and hospitality |
266.6 | 179.1 | 177.4 | 183.2 | -83.4 | -31.3 |
|
Other services |
122.5 | 102.9 | 103.1 | 103.4 | -19.1 | -15.6 |
|
Government |
344.2 | 330.6 | 324.0 | 328.0 | -16.2 | -4.7 |
|
Phoenix-Mesa-Scottsdale, AZ |
||||||
|
Total nonfarm |
2,233.5 | 2,168.6 | 2,140.5 | 2,153.9 | -79.6 | -3.6 |
|
Mining and logging |
3.3 | 2.8 | 2.8 | 2.8 | -0.5 | -15.2 |
|
Construction |
137.2 | 133.5 | 132.0 | 130.2 | -7.0 | -5.1 |
|
Manufacturing |
136.0 | 133.9 | 133.4 | 135.2 | -0.8 | -0.6 |
|
Trade, transportation, and utilities |
416.5 | 440.8 | 424.0 | 427.9 | 11.4 | 2.7 |
|
Information |
41.1 | 36.7 | 37.5 | 38.8 | -2.3 | -5.6 |
|
Financial activities |
205.7 | 205.9 | 203.3 | 203.3 | -2.4 | -1.2 |
|
Professional and business services |
372.8 | 364.9 | 361.4 | 361.9 | -10.9 | -2.9 |
|
Education and health services |
353.2 | 346.3 | 344.5 | 346.3 | -6.9 | -2.0 |
|
Leisure and hospitality |
242.3 | 194.1 | 195.1 | 197.8 | -44.5 | -18.4 |
|
Other services |
70.3 | 67.0 | 65.9 | 67.2 | -3.1 | -4.4 |
|
Government |
255.1 | 242.7 | 240.6 | 242.5 | -12.6 | -4.9 |
|
San Francisco-Oakland-Hayward, CA |
||||||
|
Total nonfarm |
2,500.8 | 2,245.4 | 2,202.5 | 2,217.3 | -283.5 | -11.3 |
|
Mining and logging |
0.4 | 0.3 | 0.3 | 0.3 | -0.1 | -25.0 |
|
Construction |
129.4 | 120.9 | 122.1 | 121.0 | -8.4 | -6.5 |
|
Manufacturing |
145.4 | 141.2 | 140.6 | 142.3 | -3.1 | -2.1 |
|
Trade, transportation, and utilities |
370.1 | 346.5 | 336.9 | 334.4 | -35.7 | -9.6 |
|
Information |
133.5 | 136.0 | 134.6 | 134.0 | 0.5 | 0.4 |
|
Financial activities |
146.8 | 140.2 | 138.1 | 137.2 | -9.6 | -6.5 |
|
Professional and business services |
505.6 | 484.1 | 477.2 | 481.0 | -24.6 | -4.9 |
|
Education and health services |
374.7 | 353.7 | 347.2 | 349.7 | -25.0 | -6.7 |
|
Leisure and hospitality |
281.9 | 153.3 | 141.5 | 150.4 | -131.5 | -46.6 |
|
Other services |
89.1 | 66.0 | 65.2 | 66.6 | -22.5 | -25.3 |
|
Government |
323.9 | 303.2 | 298.8 | 300.4 | -23.5 | -7.3 |
|
Washington-Arlington-Alexandria, DC-VA-MD-WV |
||||||
|
Total nonfarm |
3,352.8 | 3,165.6 | 3,115.9 | 3,125.6 | -227.2 | -6.8 |
|
Mining, logging, and construction |
162.8 | 162.5 | 158.7 | 157.2 | -5.6 | -3.4 |
|
Manufacturing |
56.3 | 54.8 | 54.1 | 54.8 | -1.5 | -2.7 |
|
Trade, transportation, and utilities |
404.0 | 405.0 | 391.4 | 385.8 | -18.2 | -4.5 |
|
Information |
77.0 | 72.4 | 73.1 | 72.5 | -4.5 | -5.8 |
|
Financial activities |
159.9 | 153.4 | 152.5 | 152.5 | -7.4 | -4.6 |
|
Professional and business services |
783.5 | 770.5 | 759.9 | 764.8 | -18.7 | -2.4 |
|
Education and health services |
457.9 | 423.0 | 421.6 | 425.4 | -32.5 | -7.1 |
|
Leisure and hospitality |
326.4 | 229.7 | 220.6 | 223.2 | -103.2 | -31.6 |
|
Other services |
209.5 | 189.6 | 187.9 | 187.7 | -21.8 | -10.4 |
|
Government |
715.5 | 704.7 | 696.1 | 701.7 | -13.8 | -1.9 |
|
(p) preliminary |
||||||
Last Modified Date: Wednesday, April 07, 2021