An official website of the United States government
An official website of the United States government
The .gov means it's official.
Federal government websites often end in .gov or .mil. Before sharing sensitive information,
make sure you're on a federal government site.
The site is secure.
The
https:// ensures that you are connecting to the official website and that any
information you provide is encrypted and transmitted securely.
26-633-DAL
Friday, April 10, 2026
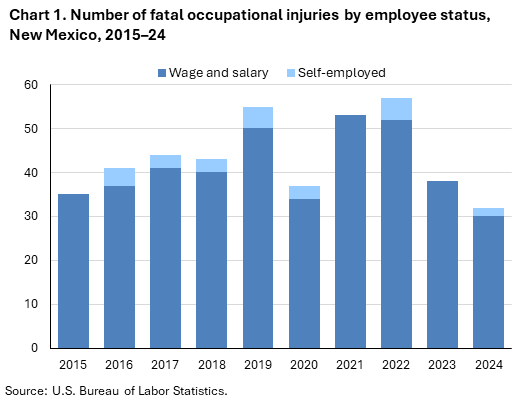
Fatal work injuries totaled 32 in 2024 for New Mexico, the U.S. Bureau of Labor Statistics reported today. Acting Regional Commissioner Jerome Watters noted that the number of work-related fatalities in New Mexico was down 15.8 percent from 38 in 2023. (See chart 1.) The fatal work injury rate was 3.6 fatalities per 100,000 full-time equivalent (FTE) workers in 2024, a decrease from a rate of 4.5 in 2023. Nationwide, a total of 5,070 fatal work injuries were recorded in 2024, a 4.0-percent decrease from 5,283 in 2023. These data are from the Census of Fatal Occupational Injuries (CFOI).
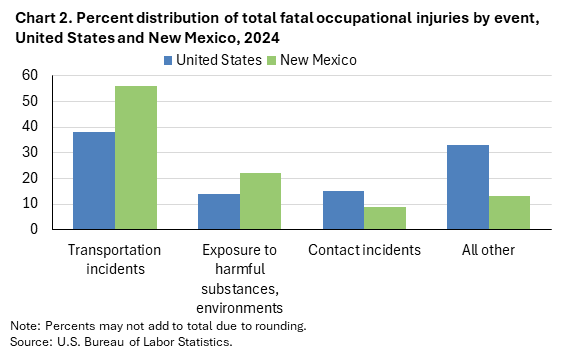
Transportation incidents (18) were the most frequent type of fatal event in New Mexico, accounting for 56 percent of all fatal work injuries in the state. Nationally the share was 38 percent. Worker deaths from transportation incidents were down from 22 over the year. (See chart 2 and table 1.)
Exposure to harmful substances, environments (7) accounted for 22 percent of New Mexico worker fatalities; nationally the share was 14 percent.
Fatalities in the transportation and warehousing sector declined to 7 in 2024 from 11 the previous year. (See table 2.)
Transportation incidents resulted in 6 of the 7 transportation and warehousing sector fatalities.
The general freight trucking industry group accounted for six of the sector’s fatal workplace injuries.
The transportation and material moving occupational group had the highest number of fatal workplace injuries with 14. (See table 3.) Heavy and tractor-trailer truck drivers accounted for 11 of the major group’s 14 fatal workplace injuries.
Fatal work injuries declined by two over the year in both the transportation and material moving and construction and extraction occupational groups.
Wage and salary workers accounted for 94 percent of fatal workplace injuries in New Mexico; the self-employed comprised the remaining 6 percent. (See chart 1 and table 4.) Nationally, wage and salary workers comprised 82 percent of fatalities.
Fatalities among Hispanic or Latino workers decreased by 3 from 13 the previous year.
White non-Hispanics accounted for 44 percent of those who died from a workplace injury. Nationwide, this group accounted for 56 percent of work-related deaths.
Workers aged 25-34 years old accounted for 31 percent of the state’s work-related fatalities in 2024, compared to 17 percent of on-the-job fatalities nationally.
Background of the program. The Census of Fatal Occupational Injuries (CFOI), part of the Bureau of Labor Statistics (BLS) Occupational Safety and Health Statistics (OSHS) program, is a count of all fatalities resulting from workplace injuries occurring in the U.S. during the calendar year. For technical information and definitions for the CFOI, see the national CFOI release Technical notes, the BLS Handbook of Methods, and the CFOI definitions.
Acknowledgments. BLS thanks the New Mexico Environment Department Occupational Health and Safety Bureau for their efforts in collecting accurate, comprehensive, and useful data on fatal work injuries. BLS also appreciates the efforts of all federal, state, local, and private sector entities that provided source documents used to identify fatal work injuries nationally. See the national CFOI release Technical Notes for details on cooperating entities.
If you are deaf, hard of hearing, or have a speech disability, please dial 7-1-1 to access telecommunications relay services.
| Event or Exposure (1) | 2023 | 2024 | |
|---|---|---|---|
| Number | Number | Percent (%) | |
All events and exposures | 38 | 32 | 100 |
Transportation incidents | 22 | 18 | 56 |
Aircraft incidents | -- | 3 | 9 |
In-flight crash, collision | -- | 3 | 9 |
Low altitude entanglement | -- | 1 | 3 |
Roadway incidents involving motorized land vehicle | 17 | 11 | 34 |
Roadway collision with other vehicle(s) | 11 | 7 | 22 |
Roadway collision with other vehicle(s)-moving in same direction | -- | 1 | 3 |
Roadway collision with other vehicle(s)-moving in opposite directions, oncoming | -- | 6 | 19 |
Roadway noncollision incident | -- | 4 | 13 |
Roadway noncollision- vehicle overturn | -- | 4 | 13 |
Nonroadway incidents involving motorized land vehicles | -- | 1 | 3 |
Nonroadway noncollision incident | -- | 1 | 3 |
Nonroadway noncollision- vehicle overturn | -- | 1 | 3 |
Exposure to harmful substances, environments | 5 | 7 | 22 |
Exposure to harmful substances | 4 | 7 | 22 |
Contact incidents | 5 | 3 | 9 |
Contact with animals | -- | 1 | 3 |
Bitten or stung by animal | -- | 1 | 3 |
Bite or sting- insects, 'bugs' | -- | 1 | 3 |
(1) Based on the BLS Occupational Injury and Illness Classification System (OIICS) version 3 implemented for 2023 data forward. | |||
Note: The Census of Fatal Occupational Injuries (CFOI) has published data on fatal occupational injuries for the United States since 1992. During this time, the classification systems and definitions of many data elements have changed. See the CFOI Definitions page (www.bls.gov/iif/definitions/census-of-fatal-occupational-injuries-definitions.htm) for a more detailed description of each data element. Data for all years are revised and final. Totals for major categories may include subcategories not shown separately. Dashes indicate no data reported or data that do not meet publication criteria. CFOI fatal injury counts exclude illness-related deaths unless precipitated by an injury event. | |||
| Industry | 2023 | 2024 | |
|---|---|---|---|
| Number | Number | Percent (%) | |
Total | 38 | 32 | 100 |
Private industry (1) | 33 | 29 | 91 |
Natural resources and mining | 5 | 8 | 25 |
Agriculture, forestry, fishing and hunting | -- | 4 | 13 |
Mining, quarrying, and oil and gas extraction | 5 | 4 | 13 |
Support activities for mining | -- | 4 | 13 |
Support activities for mining | -- | 4 | 13 |
Support activities for mining | -- | 4 | 13 |
Construction | 5 | 4 | 13 |
Construction | 5 | 4 | 13 |
Manufacturing | 4 | -- | -- |
Trade, transportation, and utilities | -- | 7 | 22 |
Transportation and warehousing | 11 | 7 | 22 |
Truck transportation | 5 | 6 | 19 |
General freight trucking | 3 | 6 | 19 |
General freight trucking, long-distance | -- | 5 | 16 |
General freight trucking, long-distance, truckload | -- | 1 | 3 |
Support activities for transportation | -- | 1 | 3 |
Support activities for air transportation | -- | 1 | 3 |
Information | -- | -- | -- |
Financial activities | -- | -- | -- |
Professional and business services | -- | -- | -- |
Educational and health services | -- | -- | -- |
Leisure and hospitality | -- | 1 | 3 |
Accommodation and food services | -- | 1 | 3 |
Food services and drinking places | -- | 1 | 3 |
Restaurants and other eating places | -- | 1 | 3 |
Restaurants and other eating places | -- | 1 | 3 |
Limited-service restaurants | -- | 1 | 3 |
Other services (except public administration) | -- | -- | -- |
Government (2) | 5 | 3 | 9 |
Federal government | -- | 1 | 3 |
State government | 3 | 1 | 3 |
Local government | -- | 1 | 3 |
(1) CFOI has used several versions of the North American Industry Classification System (NAICS) since 2003 to define industry. For complete information on the version of NAICS used in this year, see our concepts page at https://www.bls.gov/opub/hom/cfoi/concepts.htm#industry. | |||
Note: The Census of Fatal Occupational Injuries (CFOI) has published data on fatal occupational injuries for the United States since 1992. During this time, the classification systems and definitions of many data elements have changed. See the CFOI Definitions page (www.bls.gov/iif/definitions/census-of-fatal-occupational-injuries-definitions.htm) for a more detailed description of each data element. Data for all years are revised and final. Totals for major categories may include subcategories not shown separately. Dashes indicate no data reported or data that do not meet publication criteria. CFOI fatal injury counts exclude illness-related deaths unless precipitated by an injury event. | |||
| Occupation (1) | 2023 | 2024 | |
|---|---|---|---|
| Number | Number | Percent (%) | |
All occupations | 38 | 32 | 100 |
Management occupations | -- | 1 | 3 |
Other management occupations | -- | 1 | 3 |
Farmers, ranchers, and other agricultural managers | -- | 1 | 3 |
Farmers, ranchers, and other agricultural managers | -- | 1 | 3 |
Food preparation and serving related occupations | -- | 1 | 3 |
Food and beverage serving workers | -- | 1 | 3 |
Fast food and counter workers | -- | 1 | 3 |
Fast food and counter workers | -- | 1 | 3 |
Construction and extraction occupations | 8 | 6 | 19 |
Construction trades workers | 5 | 3 | 9 |
Transportation and material moving occupations | 16 | 14 | 44 |
Air transportation workers | -- | 3 | 9 |
Aircraft pilots and flight engineers | -- | 3 | 9 |
Motor vehicle operators | 16 | 11 | 34 |
Driver/sales workers and truck drivers | 16 | 11 | 34 |
Heavy and tractor-trailer truck drivers | -- | 11 | 34 |
(1) CFOI has used several versions of the Standard Occupation Classification (SOC) system since 2003 to define occupation. For complete information on the version of SOC used in these years, see the CFOI definitions page (www.bls.gov/iif/definitions/census-of-fatal-occupational-injuries-definitions.htm). Cases where occupation is unknown are included in the total. | |||
Note: The Census of Fatal Occupational Injuries (CFOI) has published data on fatal occupational injuries for the United States since 1992. During this time, the classification systems and definitions of many data elements have changed. See the CFOI Definitions page (www.bls.gov/iif/definitions/census-of-fatal-occupational-injuries-definitions.htm) for a more detailed description of each data element. Data for all years are revised and final. Totals for major categories may include subcategories not shown separately. Dashes indicate no data reported or data that do not meet publication criteria. CFOI fatal injury counts exclude illness-related deaths unless precipitated by an injury event. | |||
| Demographic | 2023 | 2024 | |
|---|---|---|---|
| Number | Number | Percent (%) | |
Total | 38 | 32 | 100 |
Employee status | |||
Wage and salary workers (1) | 38 | 30 | 94 |
Self-employed (2) | -- | 2 | 6 |
Sex | |||
Male | 34 | -- | -- |
Female | 4 | -- | -- |
Age (3) | |||
Under 16 years | -- | -- | -- |
16 to 17 years | -- | -- | -- |
18 to 19 years | -- | -- | -- |
20 to 24 years | 6 | -- | -- |
25 to 34 years | 8 | 10 | 31 |
35 to 44 years | 7 | 6 | 19 |
45 to 54 years | 7 | 5 | 16 |
55 to 64 years | 5 | 6 | 19 |
65 years and over | 5 | -- | -- |
Race or ethnic origin (4) | |||
White, non-Hispanic | 16 | 14 | 44 |
Black or African-American, non-Hispanic | 3 | -- | -- |
Hispanic or Latino | 13 | 10 | 31 |
American Indian or Alaska Native, non-Hispanic | -- | -- | -- |
Asian, non-Hispanic | -- | -- | -- |
Native Hawaiian or Pacific Islander, non-Hispanic | -- | -- | -- |
Person of multiple races, non-Hispanic | -- | -- | -- |
Other or not reported, non-Hispanic | -- | 4 | 13 |
(1) May include volunteers and workers receiving other types of compensation. Cases where employment status is unknown are included in the counts of wage and salary workers. | |||
Note: The Census of Fatal Occupational Injuries (CFOI) has published data on fatal occupational injuries for the United States since 1992. During this time, the classification systems and definitions of many data elements have changed. See the CFOI Definitions page (www.bls.gov/iif/definitions/census-of-fatal-occupational-injuries-definitions.htm) for a more detailed description of each data element. Data for all years are revised and final. Totals for major categories may include subcategories not shown separately. Dashes indicate no data reported or data that do not meet publication criteria. CFOI fatal injury counts exclude illness-related deaths unless precipitated by an injury event. | |||
Last Modified Date: Friday, April 10, 2026