An official website of the United States government
An official website of the United States government
The .gov means it's official.
Federal government websites often end in .gov or .mil. Before sharing sensitive information,
make sure you're on a federal government site.
The site is secure.
The
https:// ensures that you are connecting to the official website and that any
information you provide is encrypted and transmitted securely.
26-444-DAL
Monday, March 09, 2026
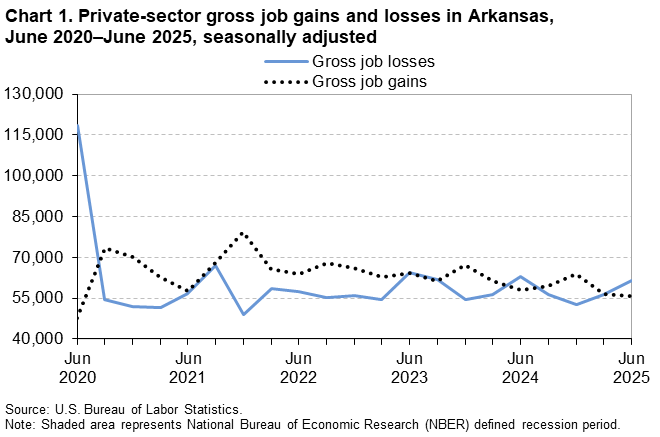
From March 2025 to June 2025, gross job losses from closing and contracting private-sector establishments in Arkansas were 61,370, while gross job gains from opening and expanding private-sector establishments were 55,899, the U.S. Bureau of Labor Statistics reported today. Acting Regional Commissioner Jerome Watters noted that the difference between the number of gross job gains and the number of gross job losses yielded a net employment loss of 5,471 jobs in the private sector during the second quarter of 2025. (See table 1.) During the previous quarter, gross job gains exceeded gross job losses by 69. (See chart 1.)
The change in the number of jobs over time is the net result of increases and decreases in employment that occur at all private businesses in the economy. Business Employment Dynamics (BED) statistics track these changes in employment at private-sector establishments from the third month of one quarter to the third month of the next. The difference between the number of gross job gains and the number of gross job losses is the net change in employment. (See the Business Employment Dynamics Technical Note.)
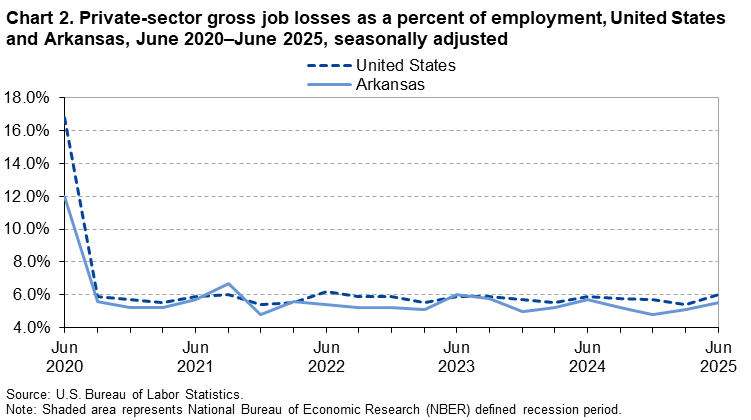
Gross job lossesIn the second quarter of 2025, gross job losses represented 5.5 percent of private-sector employment in Arkansas; nationally, gross job losses accounted for 6.0 percent of private-sector employment. (See chart 2.) Gross job losses are the result of contractions in employment at existing establishments and the loss of jobs at closing establishments. In Arkansas, contracting establishments lost 50,135 jobs in the second quarter of 2025, an increase of 4,038 jobs from the prior quarter. Closing establishments lost 11,235 jobs, an increase of 1,027 jobs from the previous quarter.
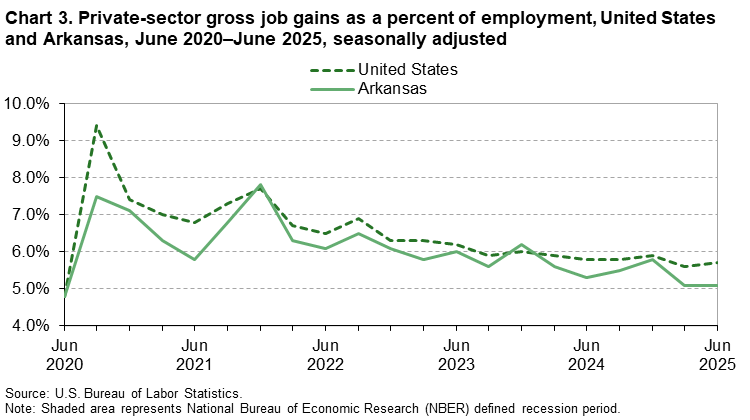
Gross job gainsIn the second quarter of 2025, gross job gains represented 5.1 percent of private-sector employment in Arkansas; nationally, gross job gains accounted for 5.7 percent of private-sector employment. (See chart 3.) Gross job gains are the sum of increases in employment due to expansions at existing establishments and the addition of new jobs at opening establishments. In Arkansas, gross job gains at expanding establishments totaled 43,859 in the second quarter of 2025, a decrease of 1,731 jobs compared to the previous quarter. Opening establishments accounted for 12,040 jobs gained in the second quarter of 2025, an increase of 1,256 jobs from the previous quarter.
IndustriesGross job losses exceeded gross job gains in 7 of the 10 published industry sectors in Arkansas in the second quarter of 2025. Retail trade had the largest over-the-quarter net job decrease, with a loss of 1,491 jobs. This was the result of 7,921 gross job losses and 6,430 gross job gains. The manufacturing industry had a net loss of 1,319 jobs. Professional and business services showed a net gain of 470 jobs, the largest gain of any sector in the state. Arkansas’ leisure and hospitality industry sector had a net gain of 368 jobs.
For more informationThe BED data series include gross job gains and gross job losses by industry subsector, for the 50 states, the District of Columbia, Puerto Rico, and the Virgin Islands, as well as gross job gains and gross job losses at the firm level by employer size class. BED data for the states have been included in table 2 of this release. Additional information is available online at the Business Employment Dynamics homepage and the Business Employment Dynamics Summary.
The Business Employment Dynamics for Third Quarter 2025 are scheduled to be released on Wednesday, April 29, 2026, at 9:00 a.m. (CT).
The Business Employment Dynamics (BED) data are a product of a federal-state cooperative program known as Quarterly Census of Employment and Wages (QCEW). The BED data are compiled by the U.S. Bureau of Labor Statistics (BLS) from existing QCEW records.
More information on formal definitions of the data used in this release, along with coverage, concepts, and methodology, can be found in the Business Employment Dynamics Technical Note.
If you are deaf, hard of hearing, or have a speech disability, please dial 7-1-1 to access telecommunications relay services.
| Category | Gross job gains and losses (3 months ended) |
Gross job gains and losses as a percent of employment (3 months ended) |
||||||||
|---|---|---|---|---|---|---|---|---|---|---|
| June 2024 |
Sept. 2024 |
Dec. 2024 |
Mar. 2025 |
June 2025 |
June 2024 |
Sept. 2024 |
Dec. 2024 |
Mar. 2025 |
June 2025 |
|
|
Total private (1) |
||||||||||
|
Gross job gains |
58,085 | 59,478 | 64,055 | 56,374 | 55,899 | 5.3 | 5.5 | 5.8 | 5.1 | 5.1 |
|
At expanding establishments |
46,436 | 47,680 | 52,112 | 45,590 | 43,859 | 4.2 | 4.4 | 4.7 | 4.1 | 4.0 |
|
At opening establishments |
11,649 | 11,798 | 11,943 | 10,784 | 12,040 | 1.1 | 1.1 | 1.1 | 1.0 | 1.1 |
|
Gross job losses |
62,995 | 56,349 | 52,715 | 56,305 | 61,370 | 5.7 | 5.2 | 4.8 | 5.1 | 5.5 |
|
At contracting establishments |
51,581 | 45,608 | 42,575 | 46,097 | 50,135 | 4.7 | 4.2 | 3.9 | 4.2 | 4.5 |
|
At closing establishments |
11,414 | 10,741 | 10,140 | 10,208 | 11,235 | 1.0 | 1.0 | 0.9 | 0.9 | 1.0 |
|
Net employment change (2) |
-4,910 | 3,129 | 11,340 | 69 | -5,471 | -0.4 | 0.3 | 1.0 | 0.0 | -0.4 |
|
Construction |
||||||||||
|
Gross job gains |
5,174 | 4,994 | 5,845 | 4,956 | 4,681 | 7.6 | 7.6 | 8.7 | 7.3 | 7.0 |
|
At expanding establishments |
3,999 | 3,896 | 4,571 | 3,845 | 3,724 | 5.9 | 5.9 | 6.8 | 5.7 | 5.6 |
|
At opening establishments |
1,175 | 1,098 | 1,274 | 1,111 | 957 | 1.7 | 1.7 | 1.9 | 1.6 | 1.4 |
|
Gross job losses |
5,452 | 5,397 | 4,943 | 5,361 | 5,667 | 8.1 | 8.1 | 7.3 | 7.9 | 8.5 |
|
At contracting establishments |
4,227 | 4,481 | 4,115 | 4,211 | 4,626 | 6.3 | 6.7 | 6.1 | 6.2 | 6.9 |
|
At closing establishments |
1,225 | 916 | 828 | 1,150 | 1,041 | 1.8 | 1.4 | 1.2 | 1.7 | 1.6 |
|
Net employment change (2) |
-278 | -403 | 902 | -405 | -986 | -0.5 | -0.5 | 1.4 | -0.6 | -1.5 |
|
Manufacturing |
||||||||||
|
Gross job gains |
4,196 | 4,393 | 3,554 | 4,037 | 3,441 | 2.6 | 2.7 | 2.2 | 2.5 | 2.2 |
|
At expanding establishments |
3,907 | 4,257 | 3,401 | 3,827 | 3,286 | 2.4 | 2.6 | 2.1 | 2.4 | 2.1 |
|
At opening establishments |
289 | 136 | 153 | 210 | 155 | 0.2 | 0.1 | 0.1 | 0.1 | 0.1 |
|
Gross job losses |
4,705 | 4,127 | 4,308 | 4,447 | 4,760 | 2.9 | 2.6 | 2.6 | 2.7 | 2.9 |
|
At contracting establishments |
4,329 | 3,719 | 4,126 | 4,067 | 4,554 | 2.7 | 2.3 | 2.5 | 2.5 | 2.8 |
|
At closing establishments |
376 | 408 | 182 | 380 | 206 | 0.2 | 0.3 | 0.1 | 0.2 | 0.1 |
|
Net employment change (2) |
-509 | 266 | -754 | -410 | -1,319 | -0.3 | 0.1 | -0.4 | -0.2 | -0.7 |
|
Wholesale trade |
||||||||||
|
Gross job gains |
2,808 | 2,766 | 2,702 | 3,004 | 2,953 | 5.3 | 5.2 | 5.0 | 5.6 | 5.5 |
|
At expanding establishments |
2,124 | 2,151 | 2,154 | 2,208 | 2,310 | 4.0 | 4.0 | 4.0 | 4.1 | 4.3 |
|
At opening establishments |
684 | 615 | 548 | 796 | 643 | 1.3 | 1.2 | 1.0 | 1.5 | 1.2 |
|
Gross job losses |
2,904 | 2,544 | 2,257 | 2,644 | 3,254 | 5.5 | 4.8 | 4.2 | 4.9 | 6.1 |
|
At contracting establishments |
2,340 | 1,911 | 1,883 | 2,115 | 2,416 | 4.4 | 3.6 | 3.5 | 3.9 | 4.5 |
|
At closing establishments |
564 | 633 | 374 | 529 | 838 | 1.1 | 1.2 | 0.7 | 1.0 | 1.6 |
|
Net employment change (2) |
-96 | 222 | 445 | 360 | -301 | -0.2 | 0.4 | 0.8 | 0.7 | -0.6 |
|
Retail trade |
||||||||||
|
Gross job gains |
6,838 | 7,711 | 6,777 | 7,137 | 6,430 | 4.7 | 5.4 | 4.8 | 5.0 | 4.5 |
|
At expanding establishments |
5,956 | 6,004 | 5,834 | 6,138 | 5,326 | 4.1 | 4.2 | 4.1 | 4.3 | 3.7 |
|
At opening establishments |
882 | 1,707 | 943 | 999 | 1,104 | 0.6 | 1.2 | 0.7 | 0.7 | 0.8 |
|
Gross job losses |
8,144 | 7,068 | 7,604 | 6,164 | 7,921 | 5.7 | 4.9 | 5.3 | 4.4 | 5.5 |
|
At contracting establishments |
6,616 | 6,111 | 6,411 | 5,230 | 6,668 | 4.6 | 4.2 | 4.5 | 3.7 | 4.6 |
|
At closing establishments |
1,528 | 957 | 1,193 | 934 | 1,253 | 1.1 | 0.7 | 0.8 | 0.7 | 0.9 |
|
Net employment change (2) |
-1,306 | 643 | -827 | 973 | -1,491 | -1.0 | 0.5 | -0.5 | 0.6 | -1.0 |
|
Transportation and warehousing |
||||||||||
|
Gross job gains |
3,275 | 2,964 | 3,597 | 2,515 | 2,341 | 5.3 | 4.8 | 5.8 | 4.0 | 3.8 |
|
At expanding establishments |
2,881 | 2,217 | 3,367 | 2,179 | 1,981 | 4.7 | 3.6 | 5.4 | 3.5 | 3.2 |
|
At opening establishments |
394 | 747 | 230 | 336 | 360 | 0.6 | 1.2 | 0.4 | 0.5 | 0.6 |
|
Gross job losses |
3,097 | 3,070 | 1,956 | 3,473 | 2,684 | 5.0 | 5.0 | 3.2 | 5.5 | 4.3 |
|
At contracting establishments |
2,520 | 2,523 | 1,593 | 3,007 | 2,379 | 4.1 | 4.1 | 2.6 | 4.8 | 3.8 |
|
At closing establishments |
577 | 547 | 363 | 466 | 305 | 0.9 | 0.9 | 0.6 | 0.7 | 0.5 |
|
Net employment change (2) |
178 | -106 | 1,641 | -958 | -343 | 0.3 | -0.2 | 2.6 | -1.5 | -0.5 |
|
Financial activities |
||||||||||
|
Gross job gains |
2,573 | 2,910 | 2,825 | 3,031 | 2,937 | 4.6 | 5.2 | 5.0 | 5.4 | 5.2 |
|
At expanding establishments |
2,021 | 2,129 | 2,016 | 2,149 | 2,179 | 3.6 | 3.8 | 3.6 | 3.8 | 3.9 |
|
At opening establishments |
552 | 781 | 809 | 882 | 758 | 1.0 | 1.4 | 1.4 | 1.6 | 1.3 |
|
Gross job losses |
3,001 | 2,407 | 2,782 | 2,748 | 3,178 | 5.4 | 4.4 | 4.9 | 4.9 | 5.7 |
|
At contracting establishments |
2,225 | 1,760 | 2,042 | 1,925 | 2,113 | 4.0 | 3.2 | 3.6 | 3.4 | 3.8 |
|
At closing establishments |
776 | 647 | 740 | 823 | 1,065 | 1.4 | 1.2 | 1.3 | 1.5 | 1.9 |
|
Net employment change (2) |
-428 | 503 | 43 | 283 | -241 | -0.8 | 0.8 | 0.1 | 0.5 | -0.5 |
|
Professional and business services |
||||||||||
|
Gross job gains |
11,771 | 11,406 | 11,794 | 10,655 | 11,118 | 7.4 | 7.1 | 7.3 | 6.5 | 6.7 |
|
At expanding establishments |
8,944 | 8,824 | 9,110 | 8,541 | 8,261 | 5.6 | 5.5 | 5.6 | 5.2 | 5.0 |
|
At opening establishments |
2,827 | 2,582 | 2,684 | 2,114 | 2,857 | 1.8 | 1.6 | 1.7 | 1.3 | 1.7 |
|
Gross job losses |
12,204 | 10,840 | 9,733 | 9,113 | 10,648 | 7.6 | 6.7 | 6.0 | 5.6 | 6.4 |
|
At contracting establishments |
10,061 | 8,231 | 7,522 | 6,694 | 8,506 | 6.3 | 5.1 | 4.6 | 4.1 | 5.1 |
|
At closing establishments |
2,143 | 2,609 | 2,211 | 2,419 | 2,142 | 1.3 | 1.6 | 1.4 | 1.5 | 1.3 |
|
Net employment change (2) |
-433 | 566 | 2,061 | 1,542 | 470 | -0.2 | 0.4 | 1.3 | 0.9 | 0.3 |
|
Education and health services |
||||||||||
|
Gross job gains |
8,517 | 8,921 | 9,133 | 7,826 | 7,887 | 4.3 | 4.5 | 4.6 | 3.8 | 3.9 |
|
At expanding establishments |
6,868 | 7,805 | 7,818 | 6,383 | 6,485 | 3.5 | 3.9 | 3.9 | 3.1 | 3.2 |
|
At opening establishments |
1,649 | 1,116 | 1,315 | 1,443 | 1,402 | 0.8 | 0.6 | 0.7 | 0.7 | 0.7 |
|
Gross job losses |
8,333 | 7,312 | 7,310 | 6,873 | 7,886 | 4.2 | 3.6 | 3.7 | 3.4 | 3.9 |
|
At contracting establishments |
6,801 | 5,854 | 5,573 | 5,684 | 6,728 | 3.4 | 2.9 | 2.8 | 2.8 | 3.3 |
|
At closing establishments |
1,532 | 1,458 | 1,737 | 1,189 | 1,158 | 0.8 | 0.7 | 0.9 | 0.6 | 0.6 |
|
Net employment change (2) |
184 | 1,609 | 1,823 | 953 | 1 | 0.1 | 0.9 | 0.9 | 0.4 | 0.0 |
|
Leisure and hospitality |
||||||||||
|
Gross job gains |
9,133 | 9,200 | 12,755 | 8,287 | 10,145 | 7.1 | 7.2 | 9.8 | 6.3 | 7.8 |
|
At expanding establishments |
6,820 | 7,176 | 9,902 | 6,474 | 7,582 | 5.3 | 5.6 | 7.6 | 4.9 | 5.8 |
|
At opening establishments |
2,313 | 2,024 | 2,853 | 1,813 | 2,563 | 1.8 | 1.6 | 2.2 | 1.4 | 2.0 |
|
Gross job losses |
10,024 | 9,097 | 7,721 | 11,300 | 9,777 | 7.8 | 7.1 | 5.8 | 8.5 | 7.5 |
|
At contracting establishments |
8,464 | 7,515 | 6,358 | 9,831 | 7,697 | 6.6 | 5.9 | 4.8 | 7.4 | 5.9 |
|
At closing establishments |
1,560 | 1,582 | 1,363 | 1,469 | 2,080 | 1.2 | 1.2 | 1.0 | 1.1 | 1.6 |
|
Net employment change (2) |
-891 | 103 | 5,034 | -3,013 | 368 | -0.7 | 0.1 | 4.0 | -2.2 | 0.3 |
|
Other services (3) |
||||||||||
|
Gross job gains |
2,177 | 2,093 | 2,295 | 2,446 | 1,972 | 7.8 | 7.6 | 8.2 | 8.5 | 7.0 |
|
At expanding establishments |
1,600 | 1,550 | 1,625 | 1,779 | 1,323 | 5.7 | 5.6 | 5.8 | 6.2 | 4.7 |
|
At opening establishments |
577 | 543 | 670 | 667 | 649 | 2.1 | 2.0 | 2.4 | 2.3 | 2.3 |
|
Gross job losses |
2,305 | 2,139 | 1,916 | 1,862 | 2,542 | 8.3 | 7.7 | 6.8 | 6.5 | 8.9 |
|
At contracting establishments |
1,787 | 1,621 | 1,402 | 1,400 | 1,850 | 6.4 | 5.8 | 5.0 | 4.9 | 6.5 |
|
At closing establishments |
518 | 518 | 514 | 462 | 692 | 1.9 | 1.9 | 1.8 | 1.6 | 2.4 |
|
Net employment change (2) |
-128 | -46 | 379 | 584 | -570 | -0.5 | -0.1 | 1.4 | 2.0 | -1.9 |
|
(1) Includes unclassified sector not shown separately. |
||||||||||
| Category | Gross job gains as a percent of employment (3 months ended) |
Gross job losses as a percent of employment (3 months ended) |
||||||||
|---|---|---|---|---|---|---|---|---|---|---|
| June 2024 |
Sept. 2024 |
Dec. 2024 |
Mar. 2025 |
June 2025 |
June 2024 |
Sept. 2024 |
Dec. 2024 |
Mar. 2025 |
June 2025 |
|
|
United States(1) |
5.8 | 5.8 | 5.9 | 5.6 | 5.7 | 5.9 | 5.8 | 5.7 | 5.4 | 6.0 |
|
Alabama |
5.6 | 5.8 | 5.8 | 5.3 | 5.5 | 5.6 | 5.9 | 5.3 | 5.6 | 5.6 |
|
Alaska |
10.2 | 8.0 | 10.3 | 10.0 | 9.9 | 9.6 | 9.6 | 9.5 | 8.1 | 10.3 |
|
Arizona |
5.6 | 6.4 | 6.1 | 5.8 | 5.3 | 6.5 | 5.7 | 5.9 | 5.3 | 6.3 |
|
Arkansas |
5.3 | 5.5 | 5.8 | 5.1 | 5.1 | 5.7 | 5.2 | 4.8 | 5.1 | 5.5 |
|
California |
6.2 | 6.3 | 6.7 | 6.0 | 6.6 | 6.9 | 6.2 | 6.4 | 6.2 | 6.7 |
|
Colorado |
6.6 | 6.3 | 6.2 | 6.2 | 6.4 | 5.8 | 6.4 | 6.5 | 6.8 | 7.1 |
|
Connecticut |
5.8 | 5.5 | 5.5 | 5.6 | 5.8 | 5.5 | 5.6 | 5.5 | 5.3 | 5.8 |
|
Delaware |
5.8 | 6.8 | 6.1 | 5.9 | 5.9 | 6.5 | 6.4 | 6.3 | 5.3 | 6.1 |
|
District of Columbia |
5.1 | 4.9 | 5.0 | 4.8 | 5.7 | 5.4 | 5.0 | 5.5 | 5.8 | 5.9 |
|
Florida |
6.1 | 6.5 | 6.0 | 5.8 | 5.7 | 5.8 | 5.7 | 6.2 | 5.5 | 5.8 |
|
Georgia |
5.9 | 5.8 | 6.0 | 5.5 | 5.5 | 5.7 | 6.1 | 5.4 | 5.7 | 5.6 |
|
Hawaii |
5.2 | 5.7 | 5.3 | 4.9 | 4.8 | 5.6 | 5.0 | 5.0 | 5.0 | 5.2 |
|
Idaho |
7.5 | 7.1 | 8.2 | 7.3 | 7.7 | 7.2 | 7.5 | 6.8 | 7.3 | 7.2 |
|
Illinois |
5.1 | 4.9 | 5.1 | 5.0 | 5.2 | 5.1 | 5.0 | 5.1 | 5.0 | 5.2 |
|
Indiana |
5.2 | 5.3 | 5.5 | 5.4 | 5.0 | 5.5 | 5.3 | 5.1 | 5.2 | 5.6 |
|
Iowa |
5.6 | 5.3 | 5.6 | 5.8 | 5.6 | 5.8 | 6.0 | 5.6 | 5.5 | 5.8 |
|
Kansas |
5.9 | 5.3 | 5.9 | 5.5 | 5.4 | 5.6 | 5.6 | 5.2 | 5.4 | 6.3 |
|
Kentucky |
5.3 | 5.4 | 5.3 | 5.2 | 5.0 | 5.8 | 5.4 | 5.5 | 4.8 | 5.4 |
|
Louisiana |
5.8 | 6.1 | 6.2 | 5.6 | 5.5 | 6.2 | 5.8 | 5.5 | 5.6 | 6.3 |
|
Maine |
7.2 | 6.2 | 7.0 | 7.4 | 7.2 | 7.1 | 7.1 | 7.1 | 6.3 | 7.4 |
|
Maryland |
7.1 | 5.9 | 6.0 | 5.9 | 5.7 | 5.9 | 6.1 | 5.9 | 5.7 | 6.2 |
|
Massachusetts |
5.7 | 5.0 | 5.3 | 5.0 | 5.5 | 5.6 | 5.8 | 5.5 | 5.1 | 5.8 |
|
Michigan |
5.7 | 5.3 | 5.4 | 5.2 | 5.8 | 5.4 | 5.8 | 5.9 | 5.3 | 5.5 |
|
Minnesota |
5.7 | 5.1 | 5.5 | 5.1 | 5.8 | 5.2 | 5.8 | 5.1 | 5.5 | 5.5 |
|
Mississippi |
5.7 | 6.3 | 6.3 | 5.7 | 6.3 | 6.3 | 5.7 | 6.2 | 6.1 | 6.5 |
|
Missouri |
5.6 | 5.6 | 5.7 | 5.4 | 5.5 | 5.8 | 5.8 | 5.3 | 5.2 | 6.1 |
|
Montana |
7.9 | 7.2 | 8.4 | 8.0 | 7.7 | 7.6 | 8.0 | 7.8 | 7.5 | 8.3 |
|
Nebraska |
5.5 | 5.6 | 5.6 | 5.2 | 5.4 | 5.6 | 5.6 | 5.5 | 5.3 | 5.5 |
|
Nevada |
5.8 | 6.2 | 6.1 | 5.4 | 6.2 | 5.8 | 5.9 | 5.6 | 5.9 | 6.3 |
|
New Hampshire |
6.1 | 5.6 | 6.3 | 6.5 | 6.3 | 6.0 | 6.7 | 5.9 | 6.1 | 6.7 |
|
New Jersey |
5.9 | 5.4 | 6.0 | 5.6 | 5.8 | 5.5 | 5.8 | 5.5 | 5.4 | 5.5 |
|
New Mexico |
6.1 | 6.3 | 6.1 | 5.9 | 5.9 | 6.5 | 6.2 | 5.9 | 5.8 | 6.0 |
|
New York |
5.8 | 5.7 | 5.7 | 6.6 | 5.9 | 5.5 | 5.8 | 5.5 | 5.0 | 7.0 |
|
North Carolina |
5.6 | 5.5 | 6.1 | 5.4 | 5.6 | 5.5 | 5.8 | 5.5 | 5.5 | 5.4 |
|
North Dakota |
6.6 | 6.5 | 6.5 | 6.7 | 6.4 | 6.6 | 6.5 | 6.6 | 6.5 | 6.7 |
|
Ohio |
5.2 | 5.2 | 5.4 | 5.2 | 5.3 | 5.3 | 5.4 | 5.1 | 4.9 | 5.4 |
|
Oklahoma |
5.7 | 6.1 | 6.0 | 5.5 | 5.5 | 6.4 | 5.5 | 5.5 | 5.3 | 6.2 |
|
Oregon |
6.0 | 6.3 | 6.2 | 5.8 | 6.4 | 6.3 | 6.6 | 6.6 | 6.2 | 6.5 |
|
Pennsylvania |
4.9 | 5.1 | 5.2 | 5.0 | 4.9 | 5.2 | 5.0 | 4.8 | 4.7 | 5.2 |
|
Rhode Island |
6.6 | 6.2 | 7.3 | 6.6 | 6.3 | 6.7 | 6.4 | 6.3 | 5.9 | 6.7 |
|
South Carolina |
6.1 | 6.2 | 6.4 | 6.1 | 5.8 | 6.0 | 5.9 | 5.9 | 5.5 | 6.6 |
|
South Dakota |
6.0 | 5.9 | 6.7 | 6.2 | 6.0 | 6.2 | 5.9 | 5.9 | 6.5 | 6.1 |
|
Tennessee |
5.5 | 5.6 | 5.5 | 5.4 | 5.1 | 5.6 | 5.7 | 6.2 | 5.1 | 5.9 |
|
Texas |
5.4 | 5.7 | 5.8 | 5.1 | 5.2 | 5.3 | 5.3 | 5.2 | 5.1 | 5.4 |
|
Utah |
6.5 | 6.8 | 6.8 | 6.6 | 6.6 | 6.9 | 6.2 | 6.3 | 6.0 | 6.6 |
|
Vermont |
6.7 | 6.6 | 6.7 | 6.9 | 6.9 | 7.4 | 7.1 | 6.7 | 6.8 | 7.5 |
|
Virginia |
5.6 | 5.8 | 5.8 | 5.6 | 5.8 | 5.7 | 5.7 | 5.5 | 5.1 | 5.8 |
|
Washington |
5.9 | 5.8 | 5.8 | 5.7 | 6.0 | 5.6 | 5.8 | 5.7 | 5.5 | 5.4 |
|
West Virginia |
7.0 | 5.9 | 6.5 | 6.4 | 5.5 | 6.7 | 6.6 | 6.1 | 5.7 | 6.3 |
|
Wisconsin |
5.3 | 5.1 | 5.3 | 5.0 | 5.3 | 5.6 | 5.5 | 5.2 | 4.9 | 5.5 |
|
Wyoming |
8.2 | 8.9 | 8.9 | 8.1 | 8.3 | 8.8 | 8.5 | 8.3 | 8.7 | 8.9 |
|
Puerto Rico |
5.5 | 5.4 | 4.3 | 6.3 | 7.0 | 4.9 | 5.0 | 5.4 | 5.4 | 6.1 |
|
Virgin Islands |
4.9 | 4.7 | 5.2 | 5.4 | 15.0 | 5.7 | 7.5 | 10.8 | 7.6 | 9.5 |
|
(1) Totals for the United States do not include data for Puerto Rico or the Virgin Islands. The sum of the states will not necessarily add to the U.S. total because of the independent seasonal adjustment of each state. |
||||||||||
Last Modified Date: Monday, March 09, 2026